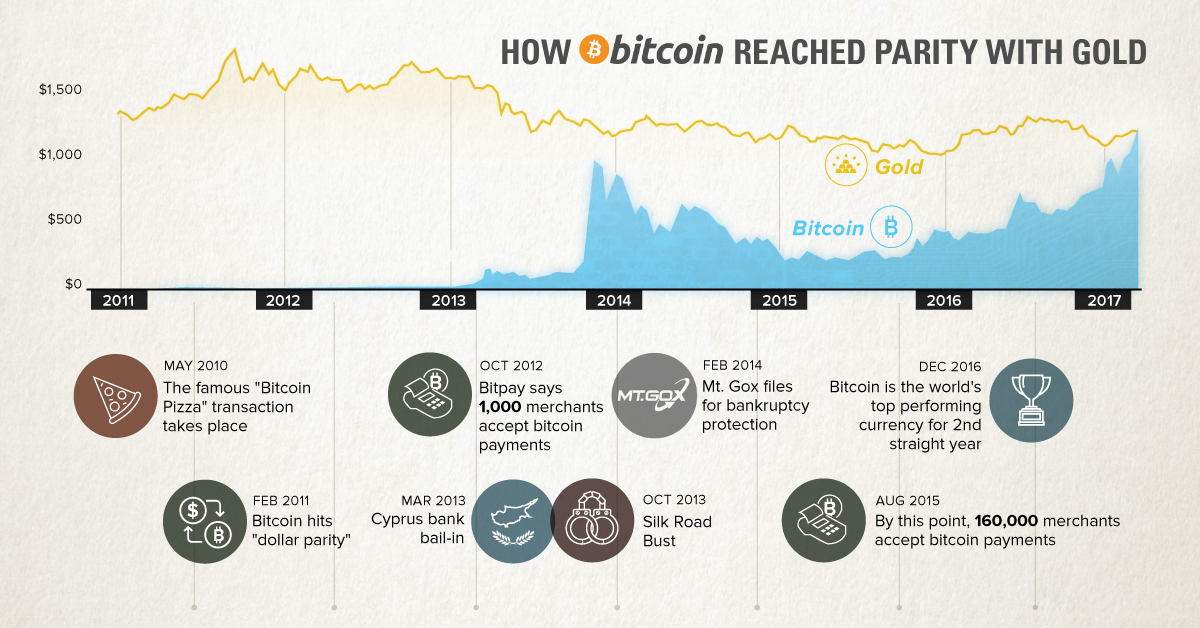
Would you rather have one bitcoin, or a single ounce of gold? The answer used to be obvious. Even at the climax of the legendary 2013 rally, bitcoin was never able to reach unit-for-unit parity with gold. However, since an off-year in 2014, the enigmatic cryptocurrency has steadily climbed in price to take the title of the best-performing currency in both 2015 and 2016. And today? After continuing its rally into 2017, the price of bitcoin has now passed this arbitrary, but psychologically important measure of parity with an ounce of gold. How did we get here so fast?
Bitcoin: A Short History
Here are some of the most important events that have shaped the bitcoin market: May 2010: The famous “Bitcoin Pizza” transaction takes place. This is one of the first “real world” transactions, in which one man indirectly paid 10,000 BTC for two Papa John’s pizzas. That works out to a pretty steep price of over $6 million per pizza using today’s prices, but we are sure they were delicious. Today, May 22 is still celebrated as “Bitcoin Pizza Day” throughout the Bitcoin community. February 2011: Bitcoin hits “dollar parity”. October 2012: Bitpay says 1,000 merchants accept bitcoin payments. Early adopters of the cryptocurrency included WordPress.com, Reddit, OKCupid, and The Pirate Bay. Mar 2013: Cyprus bank bail-in. Generally speaking, the European Debt Crisis was a major boon for bitcoin. However, this specific event really put the potential downsides of the banking system and centralized fiat currencies in the limelight. Oct 2013: Silk Road Bust As prices were soaring at the end of 2013, the FBI seized 26,000 BTC from Silk Road and its alleged owner, Ross Ulbricht. Feb 2014: Mt. Gox files for bankruptcy protection The world’s biggest exchange, which at one point controlled 70% of bitcoin transactions, was plagued with hacks and other problems. It finally went under in 2014. Aug 2015: By this point, 160,000 merchants accept bitcoin payments Dec 2016: Bitcoin is the world’s top performing currency for 2nd straight year See our charts on this for 2015 and 2016.
Bitcoin’s Rise in Context
For enthusiasts and speculators that have followed the cryptocurrency since the beginning, the meteoric rise of bitcoin has been a wild ride. However, despite the feat of reaching unit-for-unit parity with gold, it is important to take in some context. Firstly, there are about 16.2 million BTC in circulation – and there are 5.6 billion oz of gold that have been mined throughout history. For that reason the value of the gold market is still more than 300x higher. Next, while the value of the bitcoin market has soared exponentially since the early days, it is still only worth about $20 billion in total – this is about half of the value of the average company on the S&P 500 (~$40 billion). Compare the bitcoin market to an Apple or Google, and it seems even less extraordinary. But for those people that follow the crypto markets closely, this above context actually represents the potential upside of the digital cryptocurrency. It means bitcoin still has lots of room to soar – and since bitcoin supply is limited and cannot be created out of thin air, there is nowhere for the price to go but up. on Today’s chart measures the extent to which 41 major economies are reopening, by plotting two metrics for each country: the mobility rate and the COVID-19 recovery rate: Data for the first measure comes from Google’s COVID-19 Community Mobility Reports, which relies on aggregated, anonymous location history data from individuals. Note that China does not show up in the graphic as the government bans Google services. COVID-19 recovery rates rely on values from CoronaTracker, using aggregated information from multiple global and governmental databases such as WHO and CDC.
Reopening Economies, One Step at a Time
In general, the higher the mobility rate, the more economic activity this signifies. In most cases, mobility rate also correlates with a higher rate of recovered people in the population. Here’s how these countries fare based on the above metrics. Mobility data as of May 21, 2020 (Latest available). COVID-19 case data as of May 29, 2020. In the main scatterplot visualization, we’ve taken things a step further, assigning these countries into four distinct quadrants:
1. High Mobility, High Recovery
High recovery rates are resulting in lifted restrictions for countries in this quadrant, and people are steadily returning to work. New Zealand has earned praise for its early and effective pandemic response, allowing it to curtail the total number of cases. This has resulted in a 98% recovery rate, the highest of all countries. After almost 50 days of lockdown, the government is recommending a flexible four-day work week to boost the economy back up.
2. High Mobility, Low Recovery
Despite low COVID-19 related recoveries, mobility rates of countries in this quadrant remain higher than average. Some countries have loosened lockdown measures, while others did not have strict measures in place to begin with. Brazil is an interesting case study to consider here. After deferring lockdown decisions to state and local levels, the country is now averaging the highest number of daily cases out of any country. On May 28th, for example, the country had 24,151 new cases and 1,067 new deaths.
3. Low Mobility, High Recovery
Countries in this quadrant are playing it safe, and holding off on reopening their economies until the population has fully recovered. Italy, the once-epicenter for the crisis in Europe is understandably wary of cases rising back up to critical levels. As a result, it has opted to keep its activity to a minimum to try and boost the 65% recovery rate, even as it slowly emerges from over 10 weeks of lockdown.
4. Low Mobility, Low Recovery
Last but not least, people in these countries are cautiously remaining indoors as their governments continue to work on crisis response. With a low 0.05% recovery rate, the United Kingdom has no immediate plans to reopen. A two-week lag time in reporting discharged patients from NHS services may also be contributing to this low number. Although new cases are leveling off, the country has the highest coronavirus-caused death toll across Europe. The U.S. also sits in this quadrant with over 1.7 million cases and counting. Recently, some states have opted to ease restrictions on social and business activity, which could potentially result in case numbers climbing back up. Over in Sweden, a controversial herd immunity strategy meant that the country continued business as usual amid the rest of Europe’s heightened regulations. Sweden’s COVID-19 recovery rate sits at only 13.9%, and the country’s -93% mobility rate implies that people have been taking their own precautions.
COVID-19’s Impact on the Future
It’s important to note that a “second wave” of new cases could upend plans to reopen economies. As countries reckon with these competing risks of health and economic activity, there is no clear answer around the right path to take. COVID-19 is a catalyst for an entirely different future, but interestingly, it’s one that has been in the works for a while. —Carmen Reinhart, incoming Chief Economist for the World Bank Will there be any chance of returning to “normal” as we know it?