If the value of that cheese rises over time, the price may move beyond what the majority of people are willing to pay. This presents a problem as the store wants to continue selling cheese, and people still want to eat it. The obvious solution is to divide the cheese into smaller pieces. That way, more people can once again afford to buy portions of it, and those who want more can simply buy more of the smaller pieces.
The total volume of the cheese is still worth the same amount, it’s only the portion size that changed. As the infographic above by StocksToTrade demonstrates, the same concept applies to stock splits. Like wheels of cheese, stocks can be split a number of different ways. Some of the more common splits are 2-for-1, 3-for-1, and 3-for-2. Less common splits can take place as well, such as when Apple increased its outstanding shares by a 7-to-1 ratio in 2014.
Why Companies Do Stock Splits
Of course, stocks aren’t cheese. The real world of the financial markets, driven by macro trends and animal spirits, is more complex than items in a shop window. If companies want their stock price to continue rising, why would they want to split it, effectively lowering the price? Here are a some specific reasons why:
- Liquidity As our cheese example illustrated, stocks can sometimes see price appreciation to the point where they are no longer accessible to a wide range of investors. Splitting the stock (i.e. making an individual share cheaper) is an effective way of increasing the total number of investors who can purchase shares.
- Sending a Message In many cases, announcing a stock split is a harbinger of prosperity for a company. Nasdaq found that companies that split their stock outperformed the market. This is likely due to investor excitement and the fact that companies often split their stock as they approach periods of growth.
- Reducing Capital Costs Stocks with prices that are too high have spreads that are wider than similar stocks. When spreads—the difference between the bid and offer—are too large, they eats into investor returns.
- Meeting Index Criteria There are specific instances when a company may want to adjust its share price to meet certain index requirements. One example is the Dow Jones Industrial Average (DJIA), the well-known 30-stock benchmark. The Dow is considered a price-weighted index, which means that the higher a company’s stock price, the more weight and influence it has within the index. Shortly after Apple conducted its 7-to-1 stock split in 2014, dropping the share price from about $650 to $90, the company was added to the DJIA. On the flip side, a company might decide to pursue a reverse stock split. This takes the existing amount of shares held by investors and replaces them with fewer shares at a higher price. Aside from the general stigma associated with a lower share price, companies need to keep the price above a certain threshold or face the possibility of being delisted from an exchange.
Stock Splits Happen, but are not Inevitable
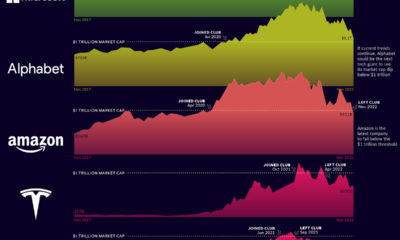
Alphabet will become the most recent high profile company to split their stock in early 2022. The company’s 20-for-1 stock split aims to make the share price more accessible to retail investors dropping the price from approximately $2,750 to $140 per share. Conversely, Berkshire Hathaway has famously never split its stock. As a result, a single share of BRK.A is worth over $470,000. Berkshire Hathaway’s legendary founder, Warren Buffett, reasons that splitting the stock would run counter to his buy-and-hold investment philosophy. on Last year, stock and bond returns tumbled after the Federal Reserve hiked interest rates at the fastest speed in 40 years. It was the first time in decades that both asset classes posted negative annual investment returns in tandem. Over four decades, this has happened 2.4% of the time across any 12-month rolling period. To look at how various stock and bond asset allocations have performed over history—and their broader correlations—the above graphic charts their best, worst, and average returns, using data from Vanguard.
How Has Asset Allocation Impacted Returns?
Based on data between 1926 and 2019, the table below looks at the spectrum of market returns of different asset allocations:
We can see that a portfolio made entirely of stocks returned 10.3% on average, the highest across all asset allocations. Of course, this came with wider return variance, hitting an annual low of -43% and a high of 54%.
A traditional 60/40 portfolio—which has lost its luster in recent years as low interest rates have led to lower bond returns—saw an average historical return of 8.8%. As interest rates have climbed in recent years, this may widen its appeal once again as bond returns may rise.
Meanwhile, a 100% bond portfolio averaged 5.3% in annual returns over the period. Bonds typically serve as a hedge against portfolio losses thanks to their typically negative historical correlation to stocks.
A Closer Look at Historical Correlations
To understand how 2022 was an outlier in terms of asset correlations we can look at the graphic below:
The last time stocks and bonds moved together in a negative direction was in 1969. At the time, inflation was accelerating and the Fed was hiking interest rates to cool rising costs. In fact, historically, when inflation surges, stocks and bonds have often moved in similar directions. Underscoring this divergence is real interest rate volatility. When real interest rates are a driving force in the market, as we have seen in the last year, it hurts both stock and bond returns. This is because higher interest rates can reduce the future cash flows of these investments. Adding another layer is the level of risk appetite among investors. When the economic outlook is uncertain and interest rate volatility is high, investors are more likely to take risk off their portfolios and demand higher returns for taking on higher risk. This can push down equity and bond prices. On the other hand, if the economic outlook is positive, investors may be willing to take on more risk, in turn potentially boosting equity prices.
Current Investment Returns in Context
Today, financial markets are seeing sharp swings as the ripple effects of higher interest rates are sinking in. For investors, historical data provides insight on long-term asset allocation trends. Over the last century, cycles of high interest rates have come and gone. Both equity and bond investment returns have been resilient for investors who stay the course.