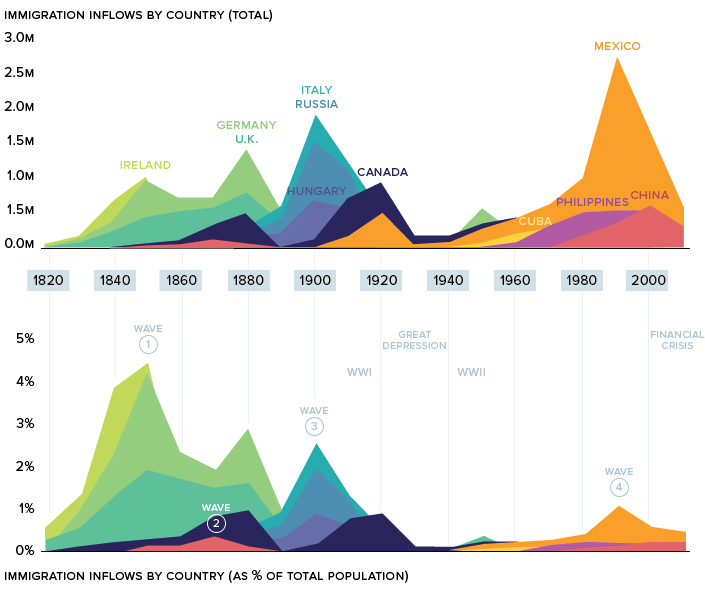
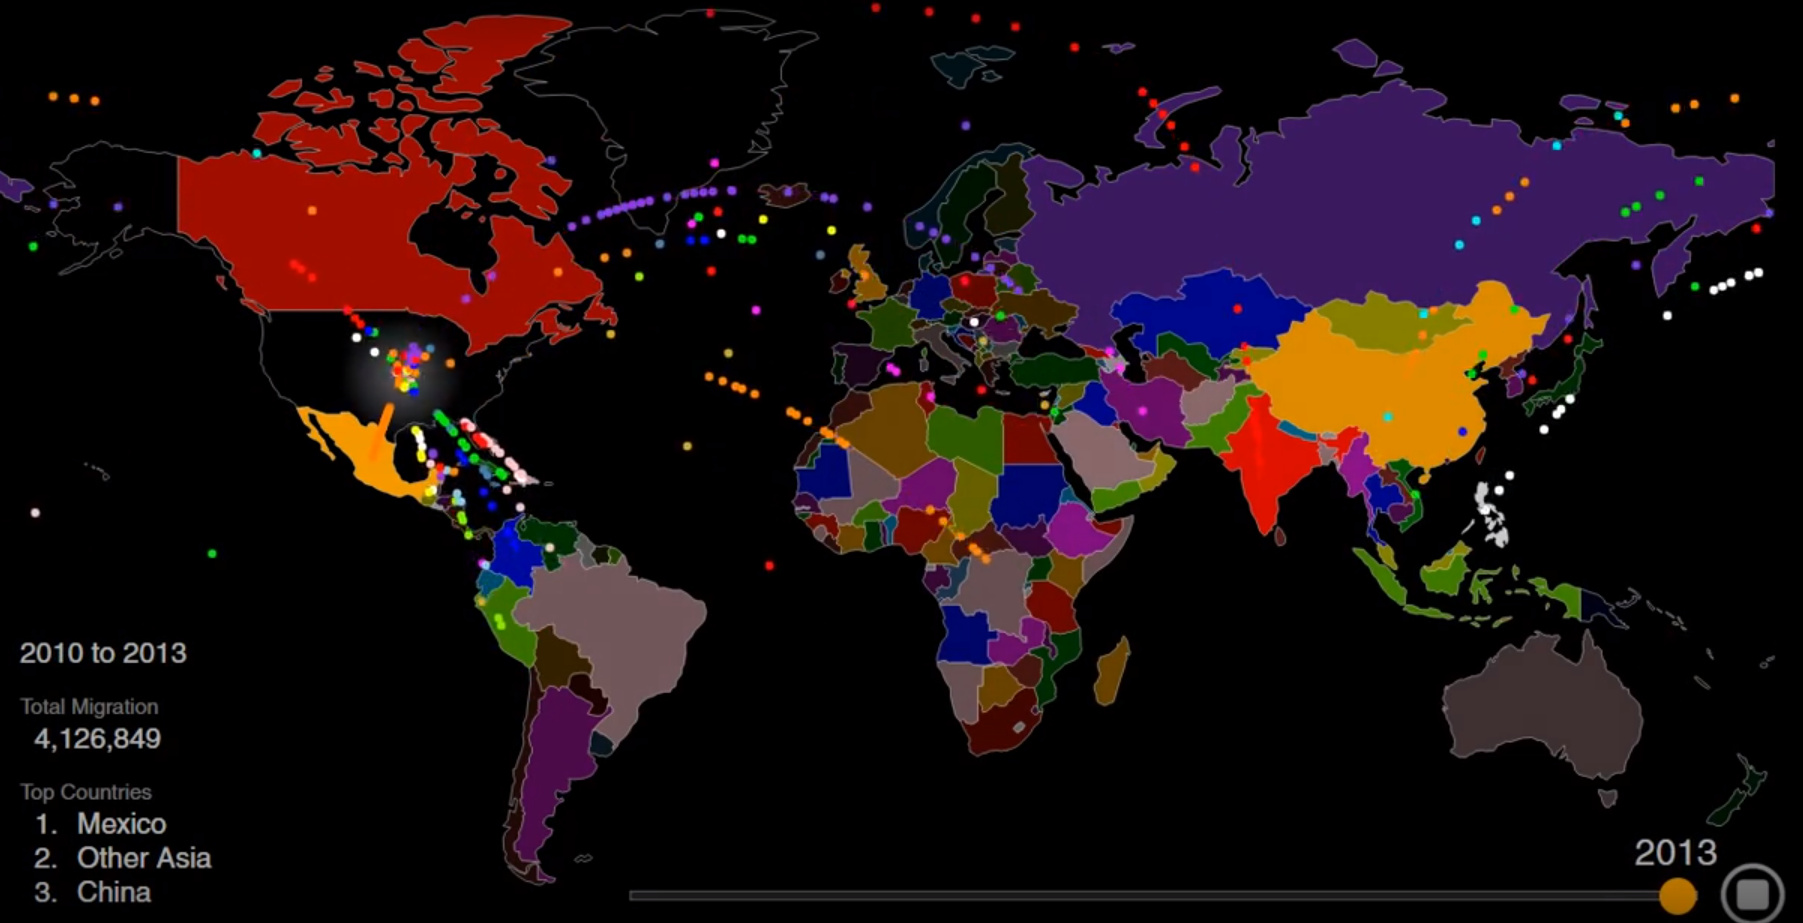
War, famine, economic boom and bust, religious persecution, and government intervention have all caused wild swings in the rate of immigration from countries around the world. Today’s striking animation, by Max Galka, is a great way to see changes in immigration over time. Inflows from specific countries rise and fall, and the top three countries of origin change numerous times over the years. Below, is another way to look at the ebb and flow of American immigration since the early 1800s. An important note. This data excludes forced migration (slavery) and illegal immigration. Let’s look at the “waves” in more detail.
Wave one: The Old Immigration
From 1820 to 1870, over 7.5 million immigrants made their way over to the United States, effectively doubling the young country’s population in only half a decade. Ireland, which was in the throes of the Potato Famine, saw half its population set sail for the U.S. during that time. This wave of immigration can still be seen in today’s demographics. There are now more Irish-Americans than there are Irish nationals. The magnetic pull of the New World was profoundly felt in Germany as well. Growing public unrest in the region, caused by heavy taxation and political censorship, culminated in the German revolutions of 1848-49. Faced with severe hardship at home, millions of Germans made their way to America over the 1800s. It’s estimated that one-third of the total ethnic German population in the world now lives in the United States.
Wave Two: Gold Rush
Much of America’s early immigration was from various points in Europe, but there was one prominent exception: China. The discovery of gold in California inspired Chinese workers to seek their fortune in America. After a crop failure in Southern China in 1852, tens of thousands of Chinese immigrants flooded into San Francisco. Although the State of California was making millions of dollars off its Foreign Miners Tax, sentiment towards Chinese workers began to sour. Gold mines were being tapped out and white Californians blamed the Chinese for driving wages down. – John Bigler, Governor of California (1852-1856) By 1882, the newly enacted the Chinese Exclusion Act had a chilling effect on Chinese immigration. The Exclusion Act has the dubious distinction of being the only American law barring a specific group from immigrating to the United States.
Wave Three: The New Immigration
The wave of immigration leading into the 20th century is referred to as The New Immigration. In 1890, Ellis Island was designated as the main point of entry for newcomers entering the United States. In 1907 alone, Ellis Island processed a staggering 1,285,349 immigrants. To put this number in perspective, if all of those people settled in one place, they would’ve formed America’s fourth largest city almost overnight. This massive influx of people into New York had profound implications on the city itself. In 1910, Manhattan’s population density was an astronomical 101,548 humans per square mile. The immigrants arriving during this period – heavily represented by Italians, Hungarians, and Russians – were seeking religious freedom and economic opportunity. Certain industries, such as steel, meat-packing, and mining, were staffed by many new arrivals to the country. During this time, one in four American workers were foreign-born.
The Great Depression
The National Origins Act’s quota system, which took effect in 1929, essentially slammed the door on most immigrants from Southern and Eastern Europe. Shortly after, the Great Depression further put a damper on immigration that would last well into the 20th century.
Wave Four: Mexico
After decades of sluggish immigration, the United States’ percentage of foreign-born citizens reached a low of 4.7% in 1970. But that was all about to change. During the next decade, the number of states where Mexico was the top country of origin doubled in a single decade, and Mexicans became the dominant foreign-born population in the country. This migration was fueled by the Latin American debt crisis and later by NAFTA. The influx of cheap corn into Mexico caused hundreds of thousands of Mexicans from rural areas to search for more favorable economic opportunities. America was the obvious choice, particularly during the economic expansion of the 1990s.
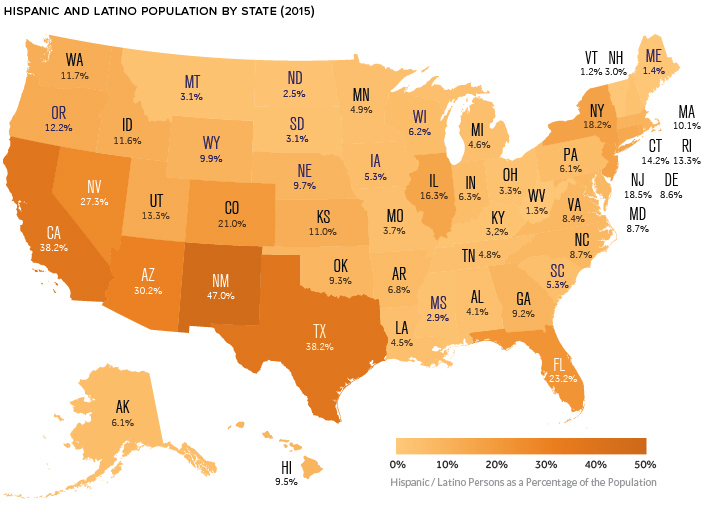
This wave of immigration has shifted the country’s demographics considerably. Today, nearly one in five people in the United States are Hispanic.
Current Trends
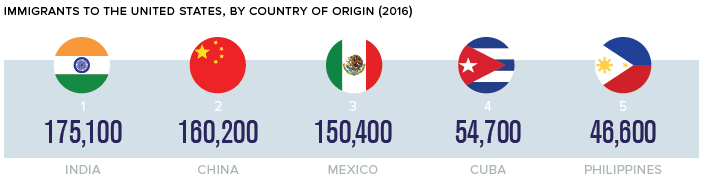
Immigration trends are continually evolving, and America’s newest immigrants are often more likely to come from China or India. In fact, both countries surpassed Mexico as countries of origin for immigrants arriving in the U.S. in 2013. Today, the trend is even more pronounced.
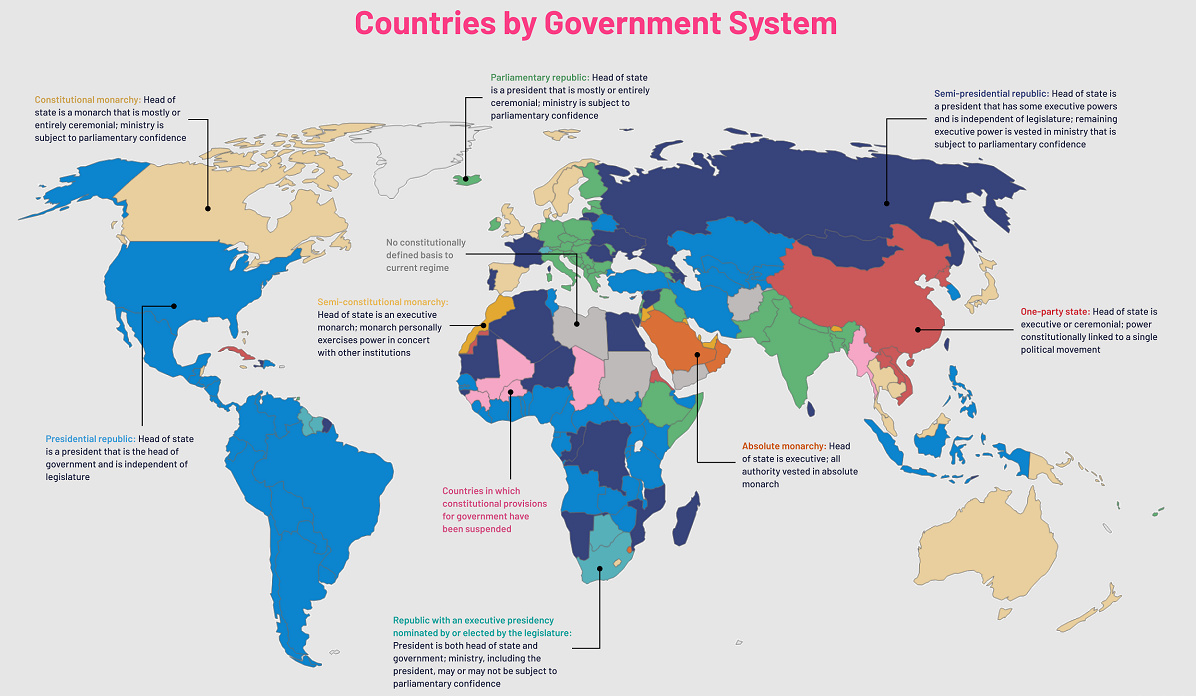
Recent immigration numbers indicate that Asian immigrants will continue to shift America’s demographics in a new direction. Perhaps a new wave in the making? on Even while political regimes across these countries have changed over time, they’ve largely followed a few different types of governance. Today, every country can ultimately be classified into just nine broad forms of government systems. This map by Truman Du uses information from Wikipedia to map the government systems that rule the world today.
Countries By Type of Government
It’s important to note that this map charts government systems according to each country’s legal framework. Many countries have constitutions stating their de jure or legally recognized system of government, but their de facto or realized form of governance may be quite different. Here is a list of the stated government system of UN member states and observers as of January 2023: Let’s take a closer look at some of these systems.
Monarchies
Brought back into the spotlight after the death of Queen Elizabeth II of England in September 2022, this form of government has a single ruler. They carry titles from king and queen to sultan or emperor, and their government systems can be further divided into three modern types: constitutional, semi-constitutional, and absolute. A constitutional monarchy sees the monarch act as head of state within the parameters of a constitution, giving them little to no real power. For example, King Charles III is the head of 15 Commonwealth nations including Canada and Australia. However, each has their own head of government. On the other hand, a semi-constitutional monarchy lets the monarch or ruling royal family retain substantial political powers, as is the case in Jordan and Morocco. However, their monarchs still rule the country according to a democratic constitution and in concert with other institutions. Finally, an absolute monarchy is most like the monarchies of old, where the ruler has full power over governance, with modern examples including Saudi Arabia and Vatican City.
Republics
Unlike monarchies, the people hold the power in a republic government system, directly electing representatives to form government. Again, there are multiple types of modern republic governments: presidential, semi-presidential, and parliamentary. The presidential republic could be considered a direct progression from monarchies. This system has a strong and independent chief executive with extensive powers when it comes to domestic affairs and foreign policy. An example of this is the United States, where the President is both the head of state and the head of government. In a semi-presidential republic, the president is the head of state and has some executive powers that are independent of the legislature. However, the prime minister (or chancellor or equivalent title) is the head of government, responsible to the legislature along with the cabinet. Russia is a classic example of this type of government. The last type of republic system is parliamentary. In this system, the president is a figurehead, while the head of government holds real power and is validated by and accountable to the parliament. This type of system can be seen in Germany, Italy, and India and is akin to constitutional monarchies. It’s also important to point out that some parliamentary republic systems operate slightly differently. For example in South Africa, the president is both the head of state and government, but is elected directly by the legislature. This leaves them (and their ministries) potentially subject to parliamentary confidence.
One-Party State
Many of the systems above involve multiple political parties vying to rule and govern their respective countries. In a one-party state, also called a single-party state or single-party system, only one political party has the right to form government. All other political parties are either outlawed or only allowed limited participation in elections. In this system, a country’s head of state and head of government can be executive or ceremonial but political power is constitutionally linked to a single political movement. China is the most well-known example of this government system, with the General Secretary of the Communist Party of China ruling as the de facto leader since 1989.
Provisional
The final form of government is a provisional government formed as an interim or transitional government. In this system, an emergency governmental body is created to manage political transitions after the collapse of a government, or when a new state is formed. Often these evolve into fully constitutionalized systems, but sometimes they hold power for longer than expected. Some examples of countries that are considered provisional include Libya, Burkina Faso, and Chad.