Canadian Housing Market, Bubble or Not?
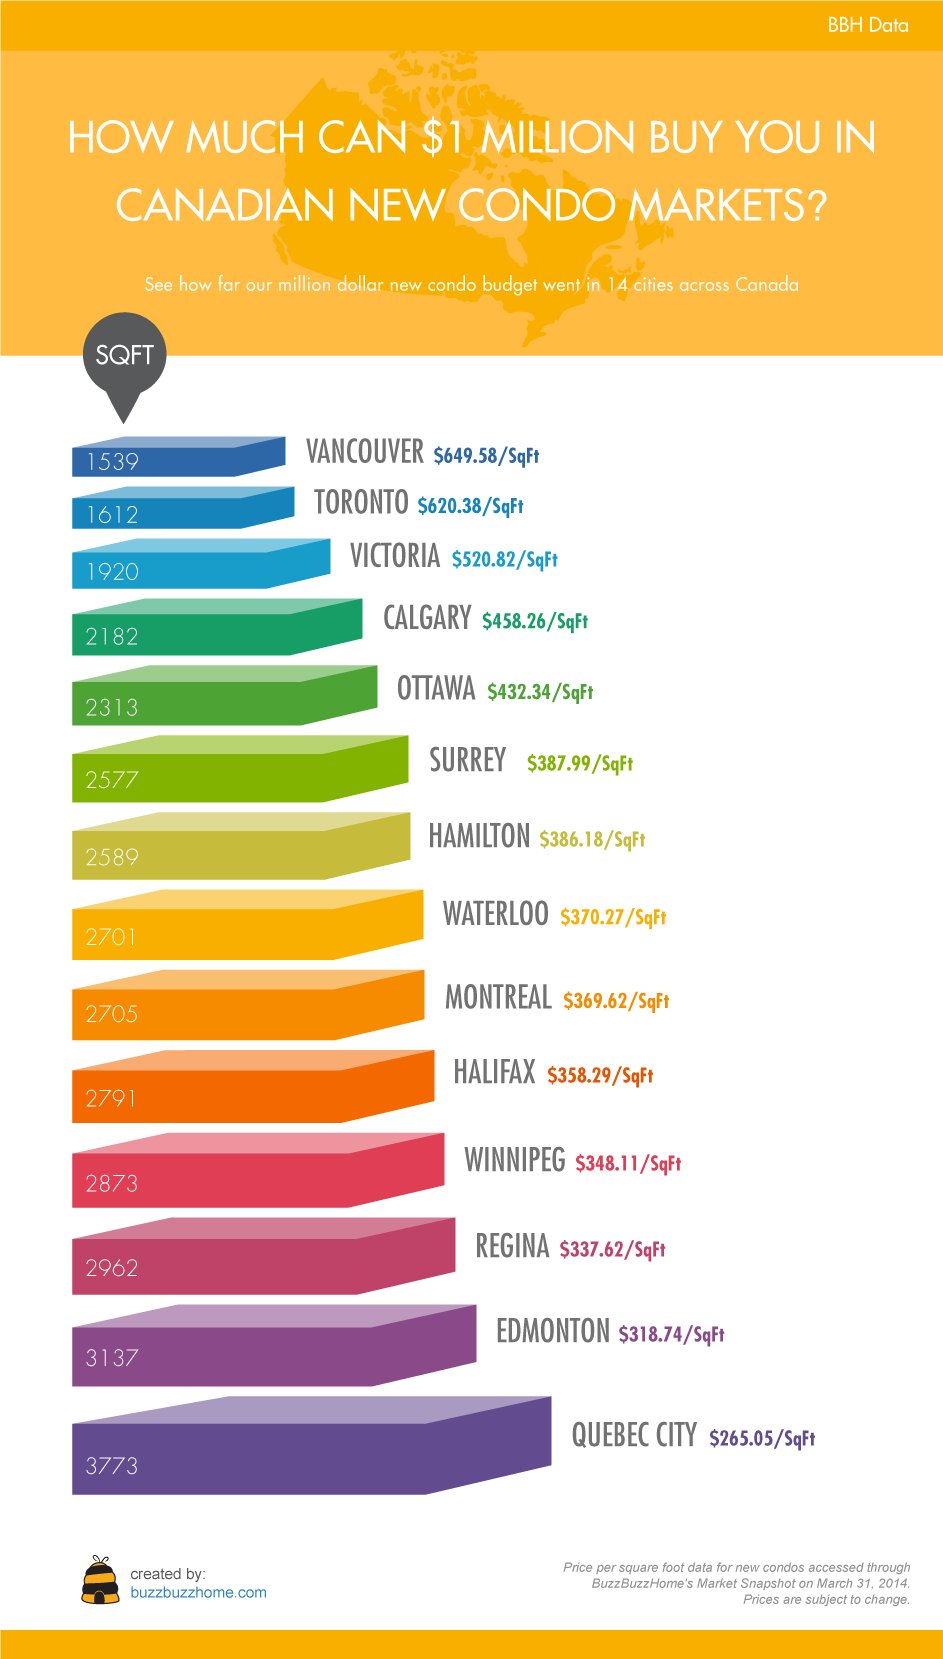
For Canadians, a topic of conversation that comes up often is the housing market. More specifically, whether or not Canada is in a bubble – and if so, will it burst? It is no secret that Canada has some of the highest real estate prices in the world. Real estate prices were not even slightly slowed by the late 2000s global recession; in fact, they kept climbing higher and higher. All while Canada’s neighbour to the south experienced a dramatic drop and has only now recovered. Even more interesting, America’s average household debt fell after the recession, but Canada’s continues to rise. This is a very concerning thought. Some attribute this to Canada having stronger fiscal health, a more stable banking system and the fruitful natural resources industry. Others say that Canada is set to experience a massive cooling down phase, one that would bring a drastic decline in housing prices. Let’s narrow in on Canada’s West Coast oasis, Vancouver. Vancouver has a reputation for being one of the most expensive cities in the world in regards to housing prices and overall cost of living. In fact, when compared to other Canadian cities’ real estate, in some cases, Vancouver is more than double in cost per square foot. A million dollars will get you a cozy 1,500 square foot condo in Vancity. But the same million will get you 1,600 square feet in Toronto, 2,700 square feet in Montreal, and almost 3,800 square feet in Quebec City, Outspoken economist, Doug Casey, seems to agree with the sentiment of Canada being overpriced, “ It’s a good time to leave Canada, since its property is quite overpriced by almost any standard – especially in Vancouver, BC.” Mr. Casey believes that Canada will suffer a similar fate as America, since Canadian banks are behaving in similar, generous fashion as their American counterparts did in the early 2000s. He also has dubbed Canada as “USA-lite.” Will the old saying, “what goes up, must come down,” apply to Canada’s housing market or is this just the new reality of the Great White North? Sources:
The Huffington Post – How Much Condo You Can Get For $1 Million In These Cities The Economist – Live Chart – Parting Company International Man – Doug Casey – Let’s Do A Tour Around The World
on Last year, stock and bond returns tumbled after the Federal Reserve hiked interest rates at the fastest speed in 40 years. It was the first time in decades that both asset classes posted negative annual investment returns in tandem. Over four decades, this has happened 2.4% of the time across any 12-month rolling period. To look at how various stock and bond asset allocations have performed over history—and their broader correlations—the above graphic charts their best, worst, and average returns, using data from Vanguard.
How Has Asset Allocation Impacted Returns?
Based on data between 1926 and 2019, the table below looks at the spectrum of market returns of different asset allocations:
We can see that a portfolio made entirely of stocks returned 10.3% on average, the highest across all asset allocations. Of course, this came with wider return variance, hitting an annual low of -43% and a high of 54%.
A traditional 60/40 portfolio—which has lost its luster in recent years as low interest rates have led to lower bond returns—saw an average historical return of 8.8%. As interest rates have climbed in recent years, this may widen its appeal once again as bond returns may rise.
Meanwhile, a 100% bond portfolio averaged 5.3% in annual returns over the period. Bonds typically serve as a hedge against portfolio losses thanks to their typically negative historical correlation to stocks.
A Closer Look at Historical Correlations
To understand how 2022 was an outlier in terms of asset correlations we can look at the graphic below:
The last time stocks and bonds moved together in a negative direction was in 1969. At the time, inflation was accelerating and the Fed was hiking interest rates to cool rising costs. In fact, historically, when inflation surges, stocks and bonds have often moved in similar directions. Underscoring this divergence is real interest rate volatility. When real interest rates are a driving force in the market, as we have seen in the last year, it hurts both stock and bond returns. This is because higher interest rates can reduce the future cash flows of these investments. Adding another layer is the level of risk appetite among investors. When the economic outlook is uncertain and interest rate volatility is high, investors are more likely to take risk off their portfolios and demand higher returns for taking on higher risk. This can push down equity and bond prices. On the other hand, if the economic outlook is positive, investors may be willing to take on more risk, in turn potentially boosting equity prices.
Current Investment Returns in Context
Today, financial markets are seeing sharp swings as the ripple effects of higher interest rates are sinking in. For investors, historical data provides insight on long-term asset allocation trends. Over the last century, cycles of high interest rates have come and gone. Both equity and bond investment returns have been resilient for investors who stay the course.