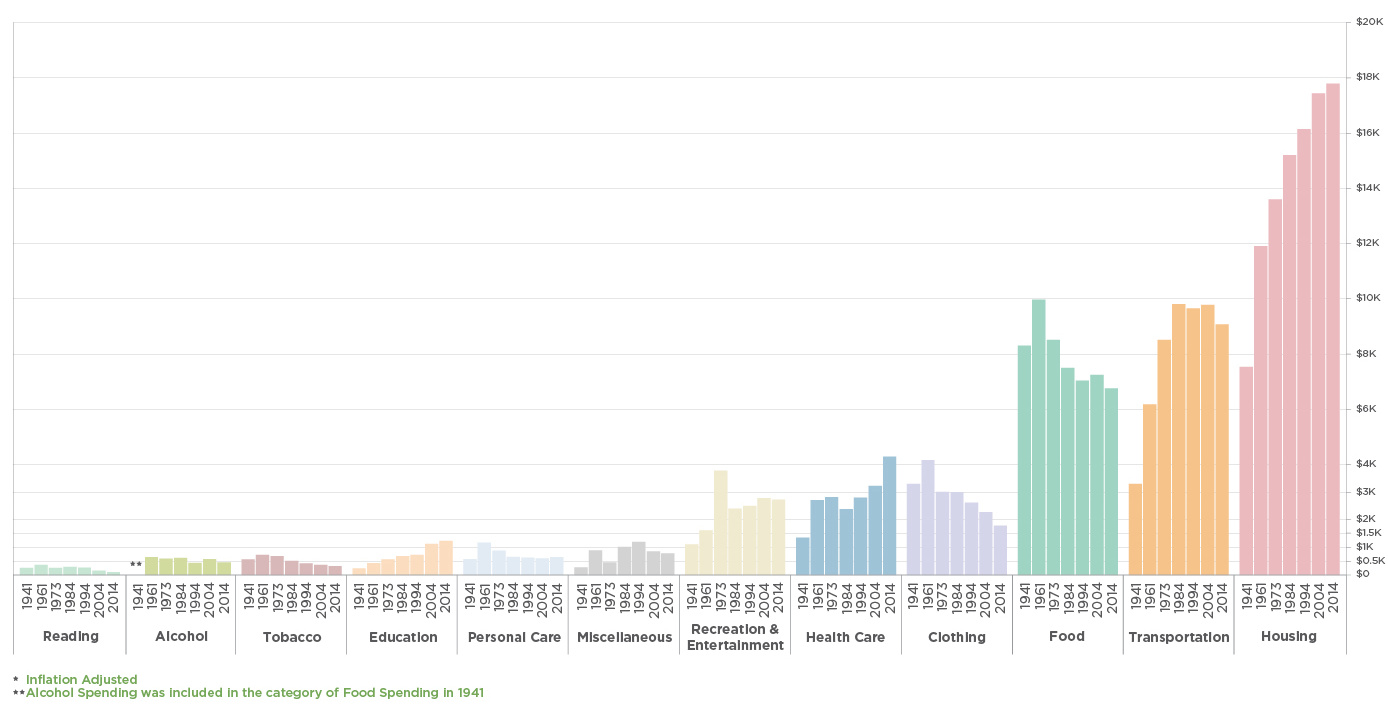
The above chart from HowMuch.net, a cost information site, plots data from the Bureau of Labor Statistics (BLS) for 12 different consumer categories over a period of nearly 75 years to show the changing way in which Americans spend their money. The data reflects median spending, and is adjusted for inflation.
Back in the Day…
One of the most interesting things about this chart is the data from 1941. What did Americans spend their money on before entering WWII, and how does that contrast with today? Interestingly, in 1941, more money was spent on food than anything else. That year, the cost of putting food on the table averaged $8,311, coinciding with a time when nearly 15% of the workforce was working in agriculture. Today, farming is obviously much more technologically advanced, and food is also grown cheaply in other countries for consumption in America. Food is now only the third-most important spending category for Americans at $6,759 per year, and only 1.6% of Americans now work agriculture, according to the World Bank. Housing has also changed dramatically over time. While it has always been a key component of spending, shelter was actually cheaper ($7,537 per year) than putting food on the table in 1941. Since then, rents and house prices have risen substantially, and Americans now spend $17,798 per year on housing. This makes it by far the largest expenditure, on average, for each person.
Trending Up, Trending Down
Over the years, cost reductions can be seen the most in both clothing and food categories, which have benefited from new technologies and cheap labor in other countries. Meanwhile, significant increases in spending can be found in healthcare, education, and transportation categories. Healthcare spending in the U.S. is a global outlier (and not in a good way), and we previously noted that textbook and tuition costs have increased 207% and 197% respectively since 1996. Lastly, the trend for money spent on transportation appears to reflect the cost of oil, which hit its highest points in the early 1980s and late 2000s. The most recent year of data from 2014 shows a notable decrease in transportation costs, which likely reflects the collapse in oil prices that occurred in mid-2014. on These are in the form of Treasury securities, some of the most liquid assets worldwide. Central banks use them for foreign exchange reserves and private investors flock to them during flights to safety thanks to their perceived low default risk. Beyond these reasons, foreign investors may buy Treasuries as a store of value. They are often used as collateral during certain international trade transactions, or countries can use them to help manage exchange rate policy. For example, countries may buy Treasuries to protect their currency’s exchange rate from speculation. In the above graphic, we show the foreign holders of the U.S. national debt using data from the U.S. Department of the Treasury.
Top Foreign Holders of U.S. Debt
With $1.1 trillion in Treasury holdings, Japan is the largest foreign holder of U.S. debt. Japan surpassed China as the top holder in 2019 as China shed over $250 billion, or 30% of its holdings in four years. This bond offloading by China is the one way the country can manage the yuan’s exchange rate. This is because if it sells dollars, it can buy the yuan when the currency falls. At the same time, China doesn’t solely use the dollar to manage its currency—it now uses a basket of currencies. Here are the countries that hold the most U.S. debt: As the above table shows, the United Kingdom is the third highest holder, at over $655 billion in Treasuries. Across Europe, 13 countries are notable holders of these securities, the highest in any region, followed by Asia-Pacific at 11 different holders. A handful of small nations own a surprising amount of U.S. debt. With a population of 70,000, the Cayman Islands own a towering amount of Treasury bonds to the tune of $284 billion. There are more hedge funds domiciled in the Cayman Islands per capita than any other nation worldwide. In fact, the four smallest nations in the visualization above—Cayman Islands, Bermuda, Bahamas, and Luxembourg—have a combined population of just 1.2 million people, but own a staggering $741 billion in Treasuries.
Interest Rates and Treasury Market Dynamics
Over 2022, foreign demand for Treasuries sank 6% as higher interest rates and a strong U.S. dollar made owning these bonds less profitable. This is because rising interest rates on U.S. debt makes the present value of their future income payments lower. Meanwhile, their prices also fall. As the chart below shows, this drop in demand is a sharp reversal from 2018-2020, when demand jumped as interest rates hovered at historic lows. A similar trend took place in the decade after the 2008-09 financial crisis when U.S. debt holdings effectively tripled from $2 to $6 trillion.
Driving this trend was China’s rapid purchase of Treasuries, which ballooned from $100 billion in 2002 to a peak of $1.3 trillion in 2013. As the country’s exports and output expanded, it sold yuan and bought dollars to help alleviate exchange rate pressure on its currency. Fast-forward to today, and global interest-rate uncertainty—which in turn can impact national currency valuations and therefore demand for Treasuries—continues to be a factor impacting the future direction of foreign U.S. debt holdings.