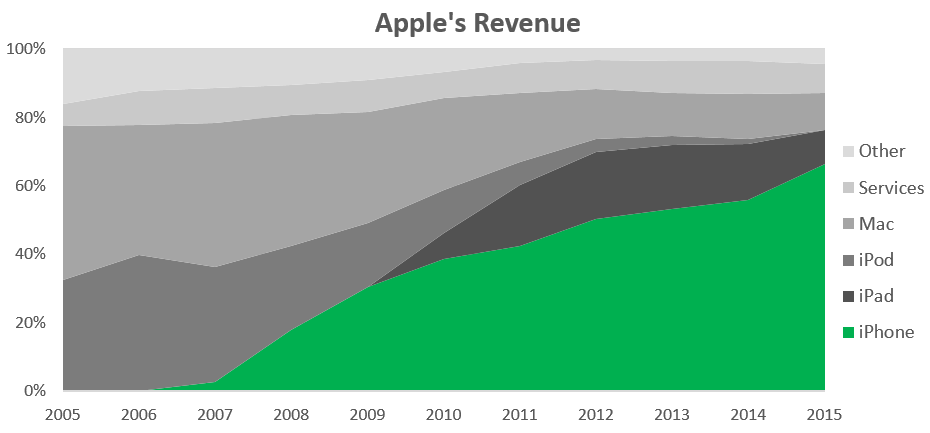
The numbers were impressive. About 48 million iPhones were sold in Q4 for a 36% increase in sales over the same quarter in 2014. The company’s solid financial position was underlined by its war chest of $205 billion in cash. Investors were delighted, and the stock ran to $120 per share, which is close to its all-time highs. The only problem? Apple’s robust iPhone sales are also the company’s biggest weakness:
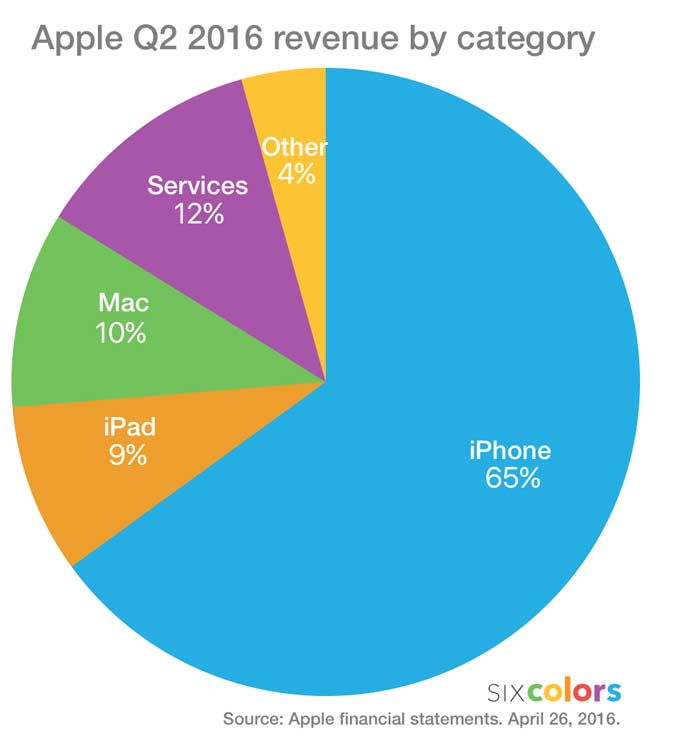
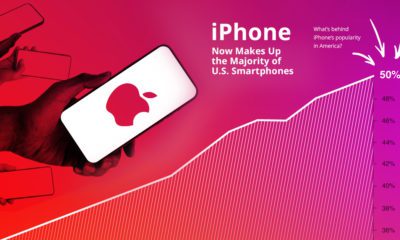
An over-reliance on iPhone sales is okay if the smartphone category is booming – but financials from Q2 in 2016 provided a wake up call to investors on Apple’s future potential iPhone prospects. Sales for the company’s flagship product declined by 16% from the quarter a year ago, and revenue fell with it by 13%. Despite this drop, iPhone sales still made up 65% of Apple’s entire revenue for the quarter.
It’s now clear to investors that perhaps there is a ceiling for iPhone sales in the future – and even if it isn’t here yet, it raises the urgent question of what Apple’s next big ticket product will be. One area to look at may be the company’s “Other Products” category, which is growing fast with 29% in quarterly revenue growth year-over-year. Comprised of the Apple Watch, Apple TV, Beats headphones, and other hardware products, could this hold the next golden goose? Right now, it’s not looking like it, as this entire group of products amounted to only $2.2 billion of revenue in Q2, equal to a measly 4.3% of iPhone sales for the same time period. Even if the “Other Products” category continues to grow at a 30% clip, it will be over 10 years before it makes a significant dent on the income statement relative to the might of the iPhone.
What’s Next?
If the next hit isn’t in Apple’s product offering today, then hopefully it is still behind closed curtains. After all, Tim Cook has hinted that there are plenty of innovative products in store. The fact that Apple has been working on an electric car has been one of the tech giant’s worst-kept secrets. MacRumors even has an entire microsite dedicated to the potential project. However, not expected to launch until 2020, will the Apple car be early enough for investors to ward off the effect of plateauing iPhone sales? Apple’s virtual reality game hasn’t been particularly impressive, either. While it has patented a VR headset to work with smartphones and there is mounting evidence that Apple is making a significant bet on VR, the company is still considered to be “behind” leaders such as Facebook’s Oculus Rift or HTC. That’s because Apple does not have a VR/AR product or an articulated strategy in the sector – not yet, anyways.
on Last year, stock and bond returns tumbled after the Federal Reserve hiked interest rates at the fastest speed in 40 years. It was the first time in decades that both asset classes posted negative annual investment returns in tandem. Over four decades, this has happened 2.4% of the time across any 12-month rolling period. To look at how various stock and bond asset allocations have performed over history—and their broader correlations—the above graphic charts their best, worst, and average returns, using data from Vanguard.
How Has Asset Allocation Impacted Returns?
Based on data between 1926 and 2019, the table below looks at the spectrum of market returns of different asset allocations:
We can see that a portfolio made entirely of stocks returned 10.3% on average, the highest across all asset allocations. Of course, this came with wider return variance, hitting an annual low of -43% and a high of 54%.
A traditional 60/40 portfolio—which has lost its luster in recent years as low interest rates have led to lower bond returns—saw an average historical return of 8.8%. As interest rates have climbed in recent years, this may widen its appeal once again as bond returns may rise.
Meanwhile, a 100% bond portfolio averaged 5.3% in annual returns over the period. Bonds typically serve as a hedge against portfolio losses thanks to their typically negative historical correlation to stocks.
A Closer Look at Historical Correlations
To understand how 2022 was an outlier in terms of asset correlations we can look at the graphic below:
The last time stocks and bonds moved together in a negative direction was in 1969. At the time, inflation was accelerating and the Fed was hiking interest rates to cool rising costs. In fact, historically, when inflation surges, stocks and bonds have often moved in similar directions. Underscoring this divergence is real interest rate volatility. When real interest rates are a driving force in the market, as we have seen in the last year, it hurts both stock and bond returns. This is because higher interest rates can reduce the future cash flows of these investments. Adding another layer is the level of risk appetite among investors. When the economic outlook is uncertain and interest rate volatility is high, investors are more likely to take risk off their portfolios and demand higher returns for taking on higher risk. This can push down equity and bond prices. On the other hand, if the economic outlook is positive, investors may be willing to take on more risk, in turn potentially boosting equity prices.
Current Investment Returns in Context
Today, financial markets are seeing sharp swings as the ripple effects of higher interest rates are sinking in. For investors, historical data provides insight on long-term asset allocation trends. Over the last century, cycles of high interest rates have come and gone. Both equity and bond investment returns have been resilient for investors who stay the course.