Banks Hit With Record Fines for Forex Manipulation [Chart]
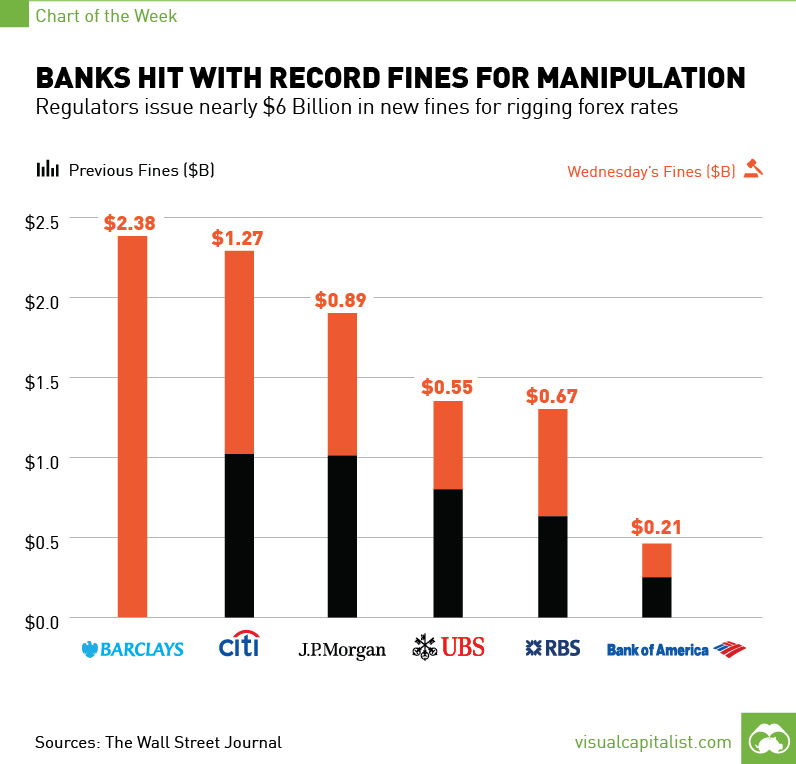
The Chart of the Week is a weekly feature in Visual Capitalist on Fridays. Few things in life are guaranteed. There’s death and taxes of course, but is anything else inevitable? We’d say the cat and mouse game between regulators and financial institutions ranks up there. The rodents are usually pretty elusive, but this week the cat had them cornered and made off with their lunch. On Wednesday, six major banks got more than just their wrists slapped by various authorities including The Fed, the Department of Justice, the Commodity Futures Trading Commission, the New York State Department of Financial Services, and the U.K. Financial Conduct Authority. The total fines add up to nearly $6 billion for the manipulation of foreign currency rates for the benefit of traders. The biggest hit this week was to Barclays, with the bank getting a $2.5 billion fine in the probe. Barclays, along with three other banks (Citi, JPMorgan, and RBS) had pleaded guilty to criminal charges for forex manipulation with the market prices for US dollars and euros. UBS, the bank that was granted immunity in the antitrust case, did also plead guilty to manipulating LIBOR. The guilty pleads are no surprise, as the details of these collusion allegations are pretty damning. Evidence of trader conversations in chatrooms have been leaked by authorities and there are pages upon pages of them. Some of the classics (from above sources):
“If you aint cheating, you aint trying.” “its just amazing how libor fixing can make you that much money” “give the rate that was most advantageous to the bank, but would not make the customer go away!” “JUST BE CAREFUL DUDE.” “I agree we shouldn’t ve been talking about putting fixings for our positions on public chat.”
Yes, you probably shouldn’t be talking about putting fixings on positions in public chat. Enjoy your new job (probably working for some government agency “teaching” them how forex manipulation works).
on Last year, stock and bond returns tumbled after the Federal Reserve hiked interest rates at the fastest speed in 40 years. It was the first time in decades that both asset classes posted negative annual investment returns in tandem. Over four decades, this has happened 2.4% of the time across any 12-month rolling period. To look at how various stock and bond asset allocations have performed over history—and their broader correlations—the above graphic charts their best, worst, and average returns, using data from Vanguard.
How Has Asset Allocation Impacted Returns?
Based on data between 1926 and 2019, the table below looks at the spectrum of market returns of different asset allocations:
We can see that a portfolio made entirely of stocks returned 10.3% on average, the highest across all asset allocations. Of course, this came with wider return variance, hitting an annual low of -43% and a high of 54%.
A traditional 60/40 portfolio—which has lost its luster in recent years as low interest rates have led to lower bond returns—saw an average historical return of 8.8%. As interest rates have climbed in recent years, this may widen its appeal once again as bond returns may rise.
Meanwhile, a 100% bond portfolio averaged 5.3% in annual returns over the period. Bonds typically serve as a hedge against portfolio losses thanks to their typically negative historical correlation to stocks.
A Closer Look at Historical Correlations
To understand how 2022 was an outlier in terms of asset correlations we can look at the graphic below:
The last time stocks and bonds moved together in a negative direction was in 1969. At the time, inflation was accelerating and the Fed was hiking interest rates to cool rising costs. In fact, historically, when inflation surges, stocks and bonds have often moved in similar directions. Underscoring this divergence is real interest rate volatility. When real interest rates are a driving force in the market, as we have seen in the last year, it hurts both stock and bond returns. This is because higher interest rates can reduce the future cash flows of these investments. Adding another layer is the level of risk appetite among investors. When the economic outlook is uncertain and interest rate volatility is high, investors are more likely to take risk off their portfolios and demand higher returns for taking on higher risk. This can push down equity and bond prices. On the other hand, if the economic outlook is positive, investors may be willing to take on more risk, in turn potentially boosting equity prices.
Current Investment Returns in Context
Today, financial markets are seeing sharp swings as the ripple effects of higher interest rates are sinking in. For investors, historical data provides insight on long-term asset allocation trends. Over the last century, cycles of high interest rates have come and gone. Both equity and bond investment returns have been resilient for investors who stay the course.