Do You Want Fries With That? [Chart]
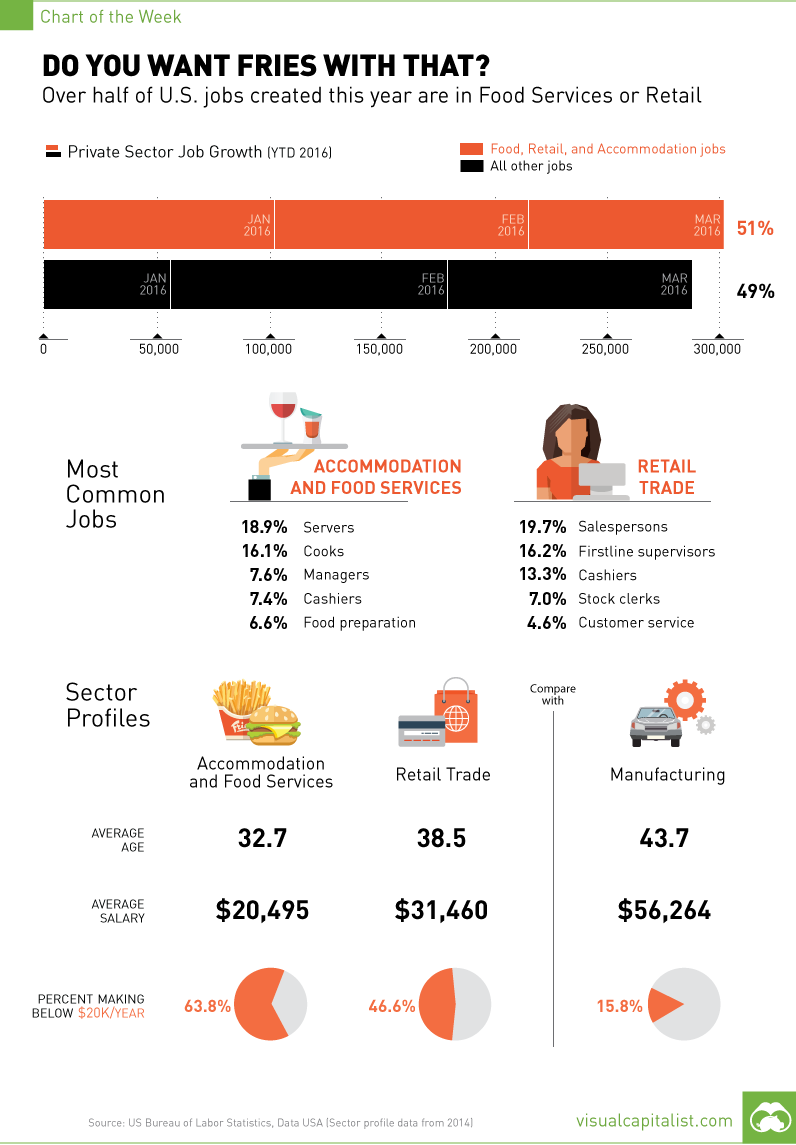
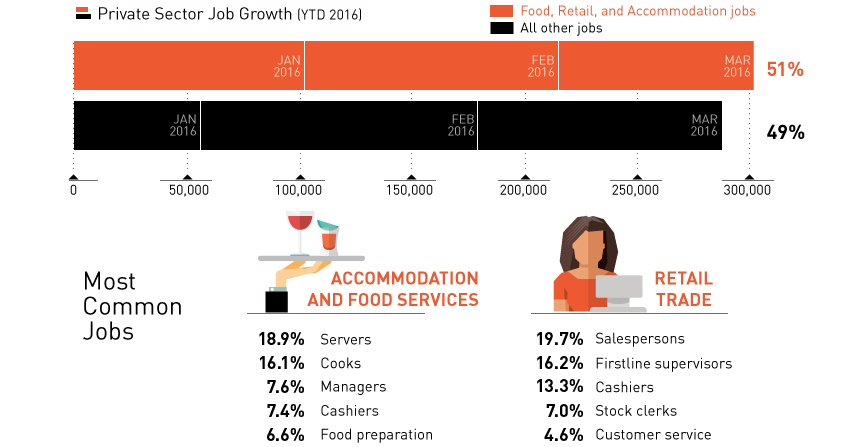
Over half of U.S. jobs created this year are in Food or Retail
The Chart of the Week is a weekly Visual Capitalist feature on Fridays. Every month, the Bureau of Labor Statistics releases its Employment Situation report, summing up the most recent government figures on employment in the United States. Investors use this information to gauge the health of the domestic economy, paying close attention to the unemployment rate, nonfarm payrolls, labor force participation, and wage growth. While this report gets dissected to death each month, we thought we’d take a more nuanced view by profiling the two sectors that have supplied the lion’s share of job growth in 2016 so far.
Numbers in Q1
In the first three months of 2016, a total of 589,000 private sector jobs were created. A variety of sectors contributed to this growth, including industries such as construction and healthcare. In particular, however, it was the “Accommodation and Food Services” and “Retail Trade” segments that added the most new workers. In combination, these sectors are the source for 51% of all new U.S. jobs in 2016 to date. While there’s absolutely nothing wrong with job growth in these sectors, an important point from an investment perspective must be made. Typically speaking, these are jobs that pay on the lower end of the spectrum, and they do little to move the needle on making the overall economy richer and more diversified.
Sector Comparison
To get an idea of the jobs that are being created, here are the five most popular positions in each segment: Accommodation and Food Services
Waiters and waitresses (18.9%) Cooks (16.1%) Food service managers (7.6%) Cashiers (7.4%) Food preparation (6.6%)
Retail Trade
Retail salespersons (19.7%) Firstline supervisors (16.2%) Cashiers (13.3%) Stock clerks (7.0%) Customer service (4.6%)
Here’s also the salary and age profile of each segment, as well as a comparison to the Manufacturing sector, which lost 29,000 jobs in March. Accommodation and Food Services
Average age: 32.7 Average salary: $20,495 Share making <$20k per year: 63.8%
Retail Trade
Average age: 38.5 Average salary: $31,460 Share making <$20k per year: 46.6%
Manufacturing
Average age: 43.7 Average salary: $56,264 Share making <$20k per year: 15.8%
Data in this section comes from DataUSA, using information from the Bureau of Labor Statistics and Census Bureau for 2014. on The good news is that the Federal Reserve, U.S. Treasury, and Federal Deposit Insurance Corporation are taking action to restore confidence and take the appropriate measures to help provide stability in the market. With this in mind, the above infographic from New York Life Investments looks at the factors that impact bonds, how different types of bonds have historically performed across market environments, and the current bond market volatility in a broader context.
Bond Market Returns
Bonds had a historic year in 2022, posting one of the worst returns ever recorded. As interest rates rose at the fastest pace in 40 years, it pushed bond prices lower due to their inverse relationship. In a rare year, bonds dropped 13%.
Source: FactSet, 01/02/2023.
Bond prices are only one part of a bond’s total return—the other looks at the income a bond provides. As interest rates have increased in the last year, it has driven higher bond yields in 2023.
Source: YCharts, 3/20/2023.
With this recent performance in mind, let’s look at some other key factors that impact the bond market.
Factors Impacting Bond Markets
Interest rates play a central role in bond market dynamics. This is because they affect a bond’s price. When rates are rising, existing bonds with lower rates are less valuable and prices decline. When rates are dropping, existing bonds with higher rates are more valuable and their prices rise. In March, the Federal Reserve raised rates 25 basis points to fall within the 4.75%-5.00% range, a level not seen since September 2007. Here are projections for where the federal funds rate is headed in 2023:
Federal Reserve Projection*: 5.1% Economist Projections**: 5.3%
*Based on median estimates in the March summary of quarterly economic projections.**Projections based on March 10-15 Bloomberg economist survey. Together, interest rates and the macroenvironment can have a positive or negative effect on bonds.
Positive
Here are three variables that may affect bond prices in a positive direction:
Lower Inflation: Reduces likelihood of interest rate hikes. Lower Interest Rates: When rates are falling, bond prices are typically higher. Recession: Can prompt a cut in interest rates, boosting bond prices.
Negative
On the other hand, here are variables that may negatively impact bond prices:
Higher Inflation: Can increase the likelihood of the Federal Reserve to raise interest rates. Rising Interest Rates: Interest rate hikes lead bond prices to fall. Weaker Fundamentals: When a bond’s credit risk gets worse, its price can drop. Credit risk indicates the chance of a default, the risk of a bond issuer not making interest payments within a given time period.
Bonds have been impacted by these negative factors since inflation started rising in March 2021.
Fixed Income Opportunities
Below, we show the types of bonds that have had the best performance during rising rates and recessions.
Source: Derek Horstmeyer, George Mason University 12/3/2022. As we can see, U.S. ultrashort bonds performed the best during rising rates. Mortgage bonds outperformed during recessions, averaging 11.4% returns, but with higher volatility. U.S. long-term bonds had 7.7% average returns, the best across all market conditions. In fact, they were also a close second during recessions. When rates are rising, ultrashort bonds allow investors to capture higher rates when they mature, often with lower historical volatility.
A Closer Look at Bond Market Volatility
While bond market volatility has jumped this year, current dislocations may provide investment opportunities. Bond dislocations allow investors to buy at lower prices, factoring in that the fundamental quality of the bond remains strong. With this in mind, here are two areas of the bond market that may provide opportunities for investors:
Investment-Grade Corporate Bonds: Higher credit quality makes them potentially less vulnerable to increasing interest rates. Intermediate Bonds (2-10 Years): Allow investors to lock in higher rates.
Both types of bonds focus on quality and capturing higher yields when faced with challenging market conditions.
Finding the Upside
Much of the volatility seen in the banking sector was due to banks buying bonds during the pandemic—or even earlier—at a time when interest rates were historically low. Since then, rates have climbed considerably. Should rates moderate or stop increasing, this may present better market conditions for bonds. In this way, today’s steep discount in bond markets may present an attractive opportunity for price appreciation. At the same time, investors can potentially lock in strong yields as inflation may subside in the coming years ahead. Learn more about bond investing strategies with New York Life Investments.