In the long-standing psychology debate on nature versus nurture, the question is whether it is our genes or our experiences that hold the keys to our future. The short answer to this question, according to many of today’s scientists and psychologists, is that nature and nurture are always working together. In other words, genes do what they do depending on their context, and nature and nurture work to influence each other constantly. In other words, our family experiences, households, and neighborhoods can set the stage for how our genes react. And on a macro level, looking at cities can tell us a lot about how our environments can help to influence future outcomes.
A Tale of Two City Types
Today’s chart pulls out some of the most compelling data from a 2015 report on intergenerational mobility. The report studies five million families that have moved between counties in the United States, ultimately showing that there is a “childhood exposure effect” in cities that helps to predict future income levels as adults. Put another way, some cities are better than others in helping kids move “up the ladder” by accessing opportunities that later affect income. On balance, other places provide a tougher environment that makes it harder. In this case, it should be noted that our above chart specifically deals with the city “bonuses” or “penalties”, expressed as an annual dollar amount for every year exposed to a city’s environment, on the future earnings of children in low-income families (25th percentile).
Digging into City Data
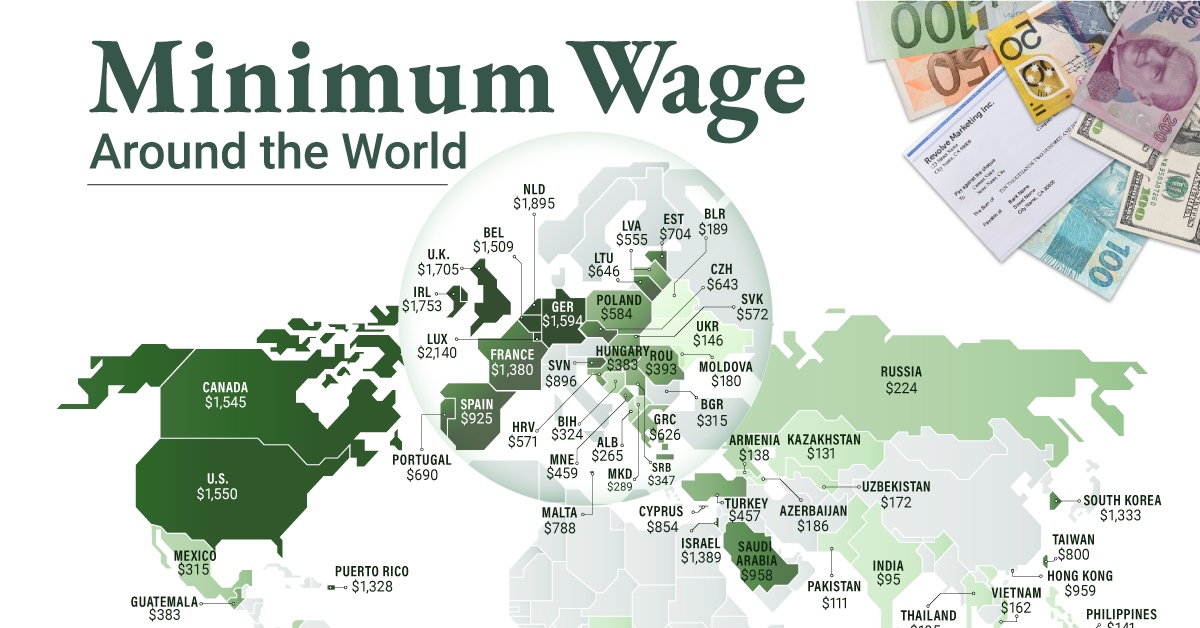
On an individual level, a person can of course succeed or fail regardless of their family or neighborhood. This happens all the time, and there are countless examples of rags-to-riches stories. The concern highlighted by this study is that, on the whole, there is a significant disparity between cities as far as predicting future income goes. Growing up for an entire childhood in New Orleans or Los Angeles, on average, means that future income will be lower than the national median. In Salt Lake City or Boston, it’s likely to be higher than the national median. The “bonuses” and “penalties” add up. For example, spending an entire childhood in New Orleans is estimated to lower future income to -$3,150 below the national median. Cities in the Northeast seem to have the most mixed bag of “place effects”. New York, Philadelphia, and Buffalo have negative effects, while Boston and Washington, D.C. are both positive. Meanwhile, the Southeast, Midwest, and Southwest all see a similar negative effect through major cities. Minneapolis and Pittsburgh are exceptions to this rule. Finally, cities in the West appear to mostly have positive effects, with the exception of Los Angeles and Fresno (not on map). on To see how the minimum wage differs around the world, we’ve visualized data from Picodi, which includes values for 67 countries as of January 2023.
Monthly Minimum Wage, by Country
The following table includes all of the data used in this infographic. Each value represents the monthly minimum wage a full-time worker would receive in each country. Picodi states that these figures are net of taxes and have been converted to USD. Generally speaking, developed countries have a higher cost of living, and thus require a higher minimum wage. Two outliers in this dataset are Argentina and Turkey, which have increased their minimum wages by 100% or more from January 2022 levels. Turkey is suffering from an ongoing currency crisis, with the lira losing over 40% of its value in 2021. Prices of basic goods have increased considerably as the Turkish lira continues to plummet. In fact, a 2022 survey found that 70% of people in Turkey were struggling to pay for food. Argentina, South America’s second-biggest economy, is also suffering from very high inflation. In response, the country announced three minimum wage increases throughout 2022.
Minimum Wage in the U.S.
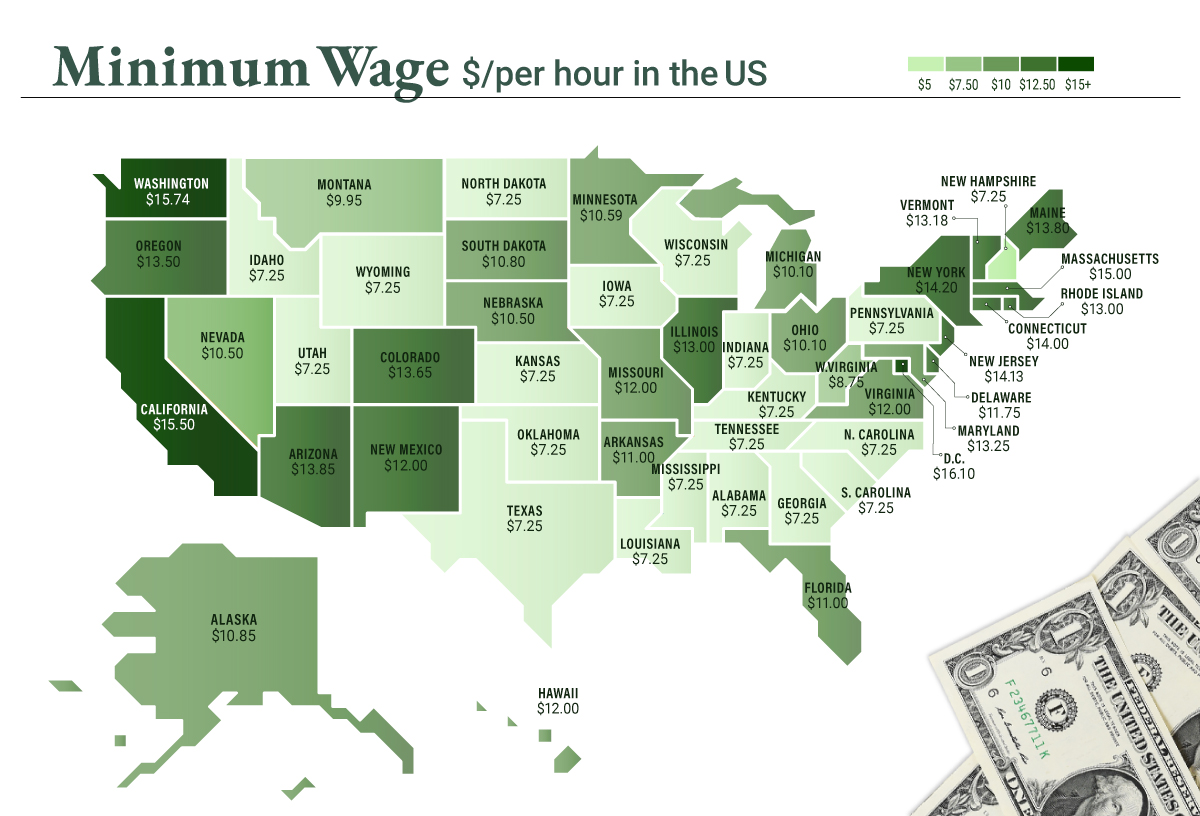
Within the U.S., minimum wage varies significantly by state. We’ve visualized each state’s basic minimum rate (hourly) using January 2023 data from the U.S. Department of Labor.
2023-03-17 Update: This map was updated to fix several incorrect values. We apologize for any confusion this may have caused. America’s federal minimum wage has remained unchanged since 2009 at $7.25 per hour. Each state is allowed to set their own minimum wage, as long as it’s higher than the federal minimum. In states that do not set their own minimum, the federal minimum applies. If we assume someone works 40 hours a week, the federal minimum wage of $7.25 translates to an annual figure of just $15,080 before taxes. California’s minimum wage of $15.50 translates to $32,240 before taxes. For further perspective, check out our 2022 infographic on the salary needed to buy a home across 50 U.S. cities.


