In fact, the difference between specific food types can vary by orders of magnitude, meaning what we eat could be a significant factor impacting GHG emissions on the environment. Today’s modified chart from Our World in Data relies on data from the largest meta-analysis of food systems in history. The study, published in Science was led by Joseph Poore and Thomas Nemecek to highlight the carbon footprint across different food types across the world.
The Foods With the Highest Carbon Footprint
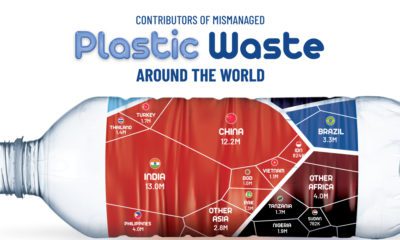
Worldwide, there are approximately 13.7 billion metric tons of carbon dioxide equivalents (CO2e) emitted through the food supply chain per year. Across a database extending through 119 countries and 38,000 commercial farms, the study found that, unsurprisingly, beef and other animal products have an outsize effect on emissions. For example, one kilogram (kg) of beef results in 60 kg of GHG emissions—nearly 2.5x the closest food type, lamb and mutton. In contrast, the same weight of apples produce less than one kilogram of GHG emissions. When it comes to plant-based foods, chocolate is among the highest GHG emitters. One kilogram of chocolate produces 19 kg of GHGs. On average, emissions from plant-based foods are 10 to 50 times lower than animal-based types. Bottom line, it is clear that the spectrum of emissions differs significantly across each food type.
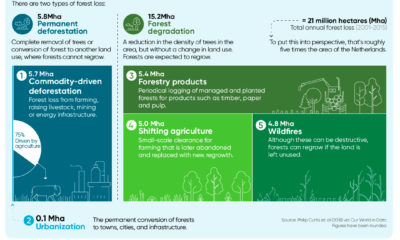
Food Supply Chain Stages
The food supply chain is complex and nuanced as it moves across each stage of the cycle. Although the steps behind the supply chain for individual foods can vary considerably, each typically has seven stages: Across all foods, the land use and farm stages of the supply chain account for 80% of GHG emissions. In beef production, for example, there are three key contributing factors to the carbon footprint at these stages: animal feed, land conversion, and methane production from cows. In the U.S., beef production accounts for 40% of total livestock-related land use domestically. On the other end of the spectrum is transportation. This stage of the supply chain makes up 10% of total GHG emissions on average. When it comes to beef, the proportion of GHGs that transportation emits is even smaller, at just 0.5% of total emissions. Contrary to popular belief, sourcing food locally may not help GHG emissions in a very significant way, especially in the case of foods with a large carbon footprint.
The Rise of Plant-Based Alternatives
Amid a growing market share of plant-based alternatives in markets around the world, the future of the food supply chain could undergo a significant transition. For investors, this shift is already evident. Beyond Meat, a leading provider of meat substitutes, was one of the best performing stocks of 2019—gaining 202% after its IPO in May 2019. As rising awareness about the environment becomes more prevalent, is it possible that growing meat consumption could be a thing of the past? on Over recent decades, farmers have been able to more than double their production of crops thanks to fertilizers and the vital nutrients they contain. When crops are harvested, the essential nutrients are taken away with them to the dining table, resulting in the depletion of these nutrients in the soil. To replenish these nutrients, fertilizers are needed, and the cycle continues. The above infographic by Brazil Potash shows the role that each macronutrient plays in growing healthy, high-yielding crops.
Food for Growth
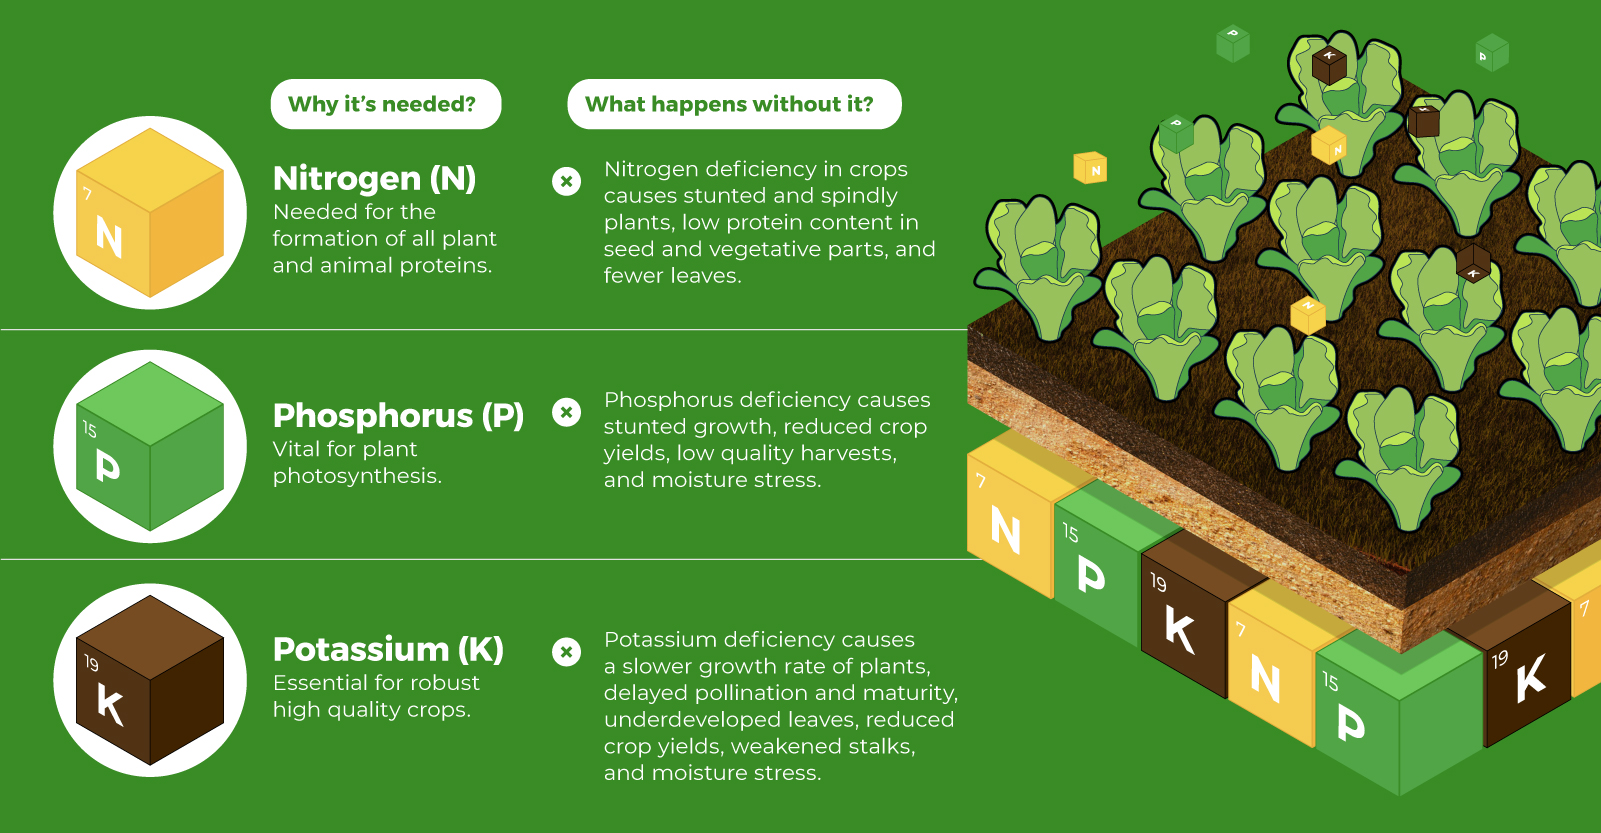
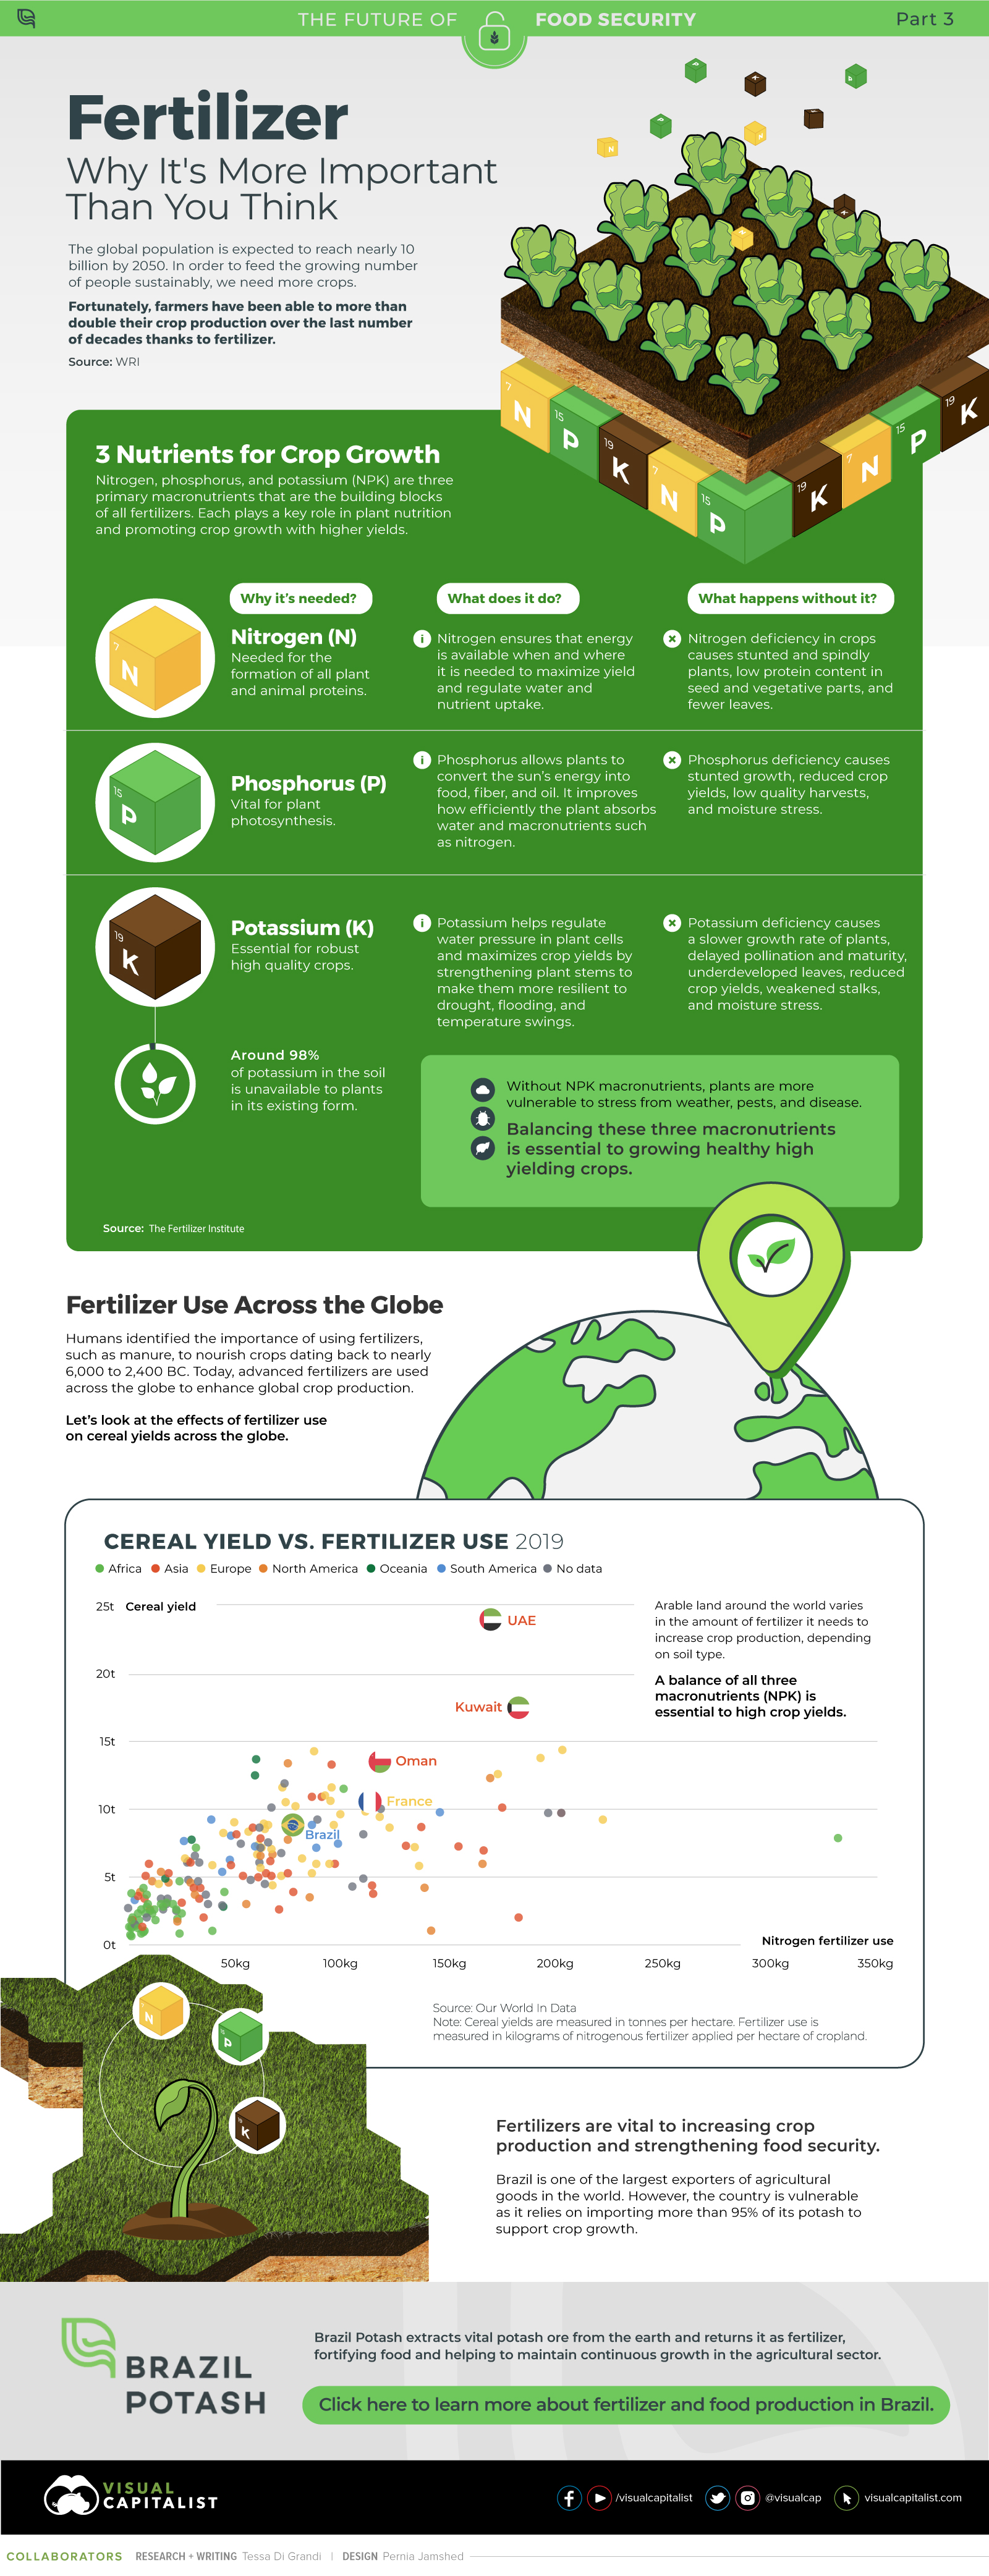
Nitrogen, phosphorus, and potassium (NPK) are three primary macronutrients that are the building blocks of the global fertilizer industry. Each plays a key role in plant nutrition and promoting crop growth with higher yields. Let’s take a look at how each macronutrient affects plant growth. If crops lack NPK macronutrients, they become vulnerable to various stresses caused by weather conditions, pests, and diseases. Therefore, it is crucial to maintain a balance of all three macronutrients for the production of healthy, high-yielding crops.
The Importance of Fertilizers
Humans identified the importance of using fertilizers, such as manure, to nourish crops dating back to nearly 6,000 to 2,400 BC. As agriculture became more intensive and large-scale, farmers began to experiment with different types of fertilizers. Today advanced chemical fertilizers are used across the globe to enhance global crop production. There are a myriad of factors that affect soil type, and so the farmable land must have a healthy balance of all three macronutrients to support high-yielding, healthy crops. Consequently, arable land around the world varies in the amount and type of fertilizer it needs. Fertilizers play an integral role in strengthening food security, and a supply of locally available fertilizer is needed in supporting global food systems in an ever-growing world. Brazil is one of the largest exporters of agricultural goods in the world. However, the country is vulnerable as it relies on importing more than 95% of its potash to support crop growth. Brazil Potash is developing a new potash project in Brazil to ensure a stable domestic source of this nutrient-rich fertilizer critical for global food security. Click here to learn more about fertilizer and food production in Brazil.