For example, during the span of 2003-2011, the three major U.S. carriers (American, United, and Delta) all filed for bankruptcy, and this was subsequently after merging with other large airlines (US Airways, Continental, and Northwest) that each had their own solvency issues. Despite the rough ride a decade ago, just last year the industry raked in $35.6 billion in profits – a record-setting amount according to the International Air Transport Association (IATA). Even legendary investor Warren Buffett is flying high on airline stocks at the moment, and he’s recently floated the idea of buying a whole carrier for Berkshire’s portfolio.
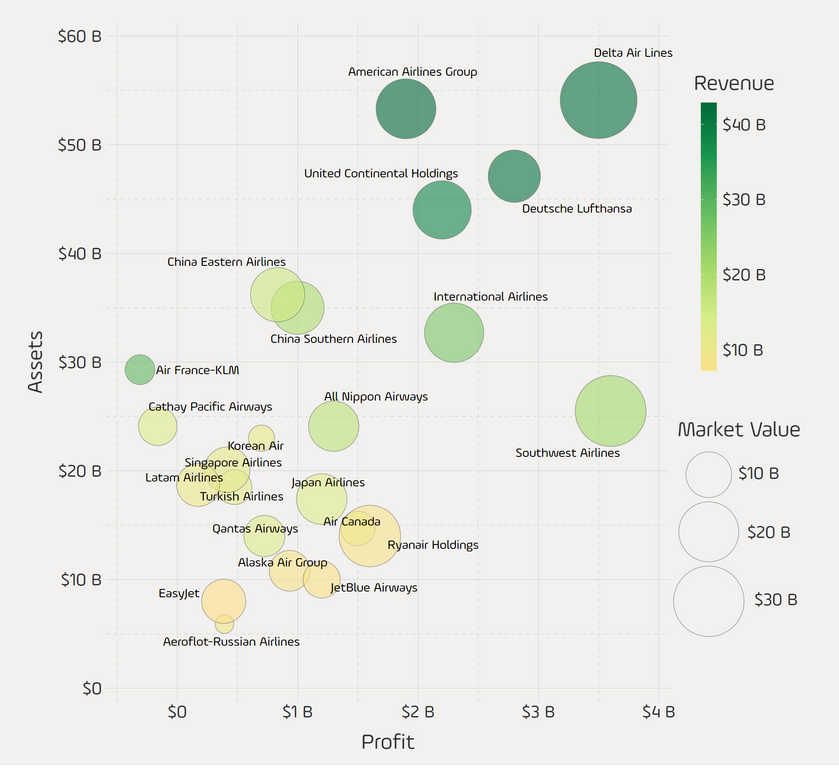
Comparing Airlines
Today’s graphic comes from Reddit user /u/takeasecond and it uses data from the Forbes Global 2000 list to plot the world’s largest publicly-traded airlines in terms of revenue, profit, assets, and market value. It provides some interesting insights on the industry, showing some unexpected carriers leading the way.
There are four companies that stand out instantly on the chart. Air France-KLM and Cathay Pacific are both easy to spot, but for the wrong reasons. They are to the left of the $0 profit line, and Forbes has their most recent net incomes listed as -$309 million and -$162 million respectively. In the upper right corner, Delta Air Lines appears to be one of the healthiest companies by many measures. It ranks second in sales ($42B) and profitability ($3.5B), and comes out on top in terms of assets ($54B) and market value ($37B). Finally, to the bottom right is Southwest Airlines – it has the highest profitability ($3.6B) but is able to do it at far higher margins than the rest of the pack.
Ranking Profitability and Sales
Here are two of the most important metrics – revenue and profit – for the 10 publicly-traded airlines with the most sales:
In recent months, the IATA has revised its outlook for 2018 after originally forecasting record-setting airline revenues again. The organization now sees profits falling to $33.8 billion, a 12% decrease on its original forecast.
on The good news is that the Federal Reserve, U.S. Treasury, and Federal Deposit Insurance Corporation are taking action to restore confidence and take the appropriate measures to help provide stability in the market. With this in mind, the above infographic from New York Life Investments looks at the factors that impact bonds, how different types of bonds have historically performed across market environments, and the current bond market volatility in a broader context.
Bond Market Returns
Bonds had a historic year in 2022, posting one of the worst returns ever recorded. As interest rates rose at the fastest pace in 40 years, it pushed bond prices lower due to their inverse relationship. In a rare year, bonds dropped 13%.
Source: FactSet, 01/02/2023.
Bond prices are only one part of a bond’s total return—the other looks at the income a bond provides. As interest rates have increased in the last year, it has driven higher bond yields in 2023.
Source: YCharts, 3/20/2023.
With this recent performance in mind, let’s look at some other key factors that impact the bond market.
Factors Impacting Bond Markets
Interest rates play a central role in bond market dynamics. This is because they affect a bond’s price. When rates are rising, existing bonds with lower rates are less valuable and prices decline. When rates are dropping, existing bonds with higher rates are more valuable and their prices rise. In March, the Federal Reserve raised rates 25 basis points to fall within the 4.75%-5.00% range, a level not seen since September 2007. Here are projections for where the federal funds rate is headed in 2023:
Federal Reserve Projection*: 5.1% Economist Projections**: 5.3%
*Based on median estimates in the March summary of quarterly economic projections.**Projections based on March 10-15 Bloomberg economist survey. Together, interest rates and the macroenvironment can have a positive or negative effect on bonds.
Positive
Here are three variables that may affect bond prices in a positive direction:
Lower Inflation: Reduces likelihood of interest rate hikes. Lower Interest Rates: When rates are falling, bond prices are typically higher. Recession: Can prompt a cut in interest rates, boosting bond prices.
Negative
On the other hand, here are variables that may negatively impact bond prices:
Higher Inflation: Can increase the likelihood of the Federal Reserve to raise interest rates. Rising Interest Rates: Interest rate hikes lead bond prices to fall. Weaker Fundamentals: When a bond’s credit risk gets worse, its price can drop. Credit risk indicates the chance of a default, the risk of a bond issuer not making interest payments within a given time period.
Bonds have been impacted by these negative factors since inflation started rising in March 2021.
Fixed Income Opportunities
Below, we show the types of bonds that have had the best performance during rising rates and recessions.
Source: Derek Horstmeyer, George Mason University 12/3/2022. As we can see, U.S. ultrashort bonds performed the best during rising rates. Mortgage bonds outperformed during recessions, averaging 11.4% returns, but with higher volatility. U.S. long-term bonds had 7.7% average returns, the best across all market conditions. In fact, they were also a close second during recessions. When rates are rising, ultrashort bonds allow investors to capture higher rates when they mature, often with lower historical volatility.
A Closer Look at Bond Market Volatility
While bond market volatility has jumped this year, current dislocations may provide investment opportunities. Bond dislocations allow investors to buy at lower prices, factoring in that the fundamental quality of the bond remains strong. With this in mind, here are two areas of the bond market that may provide opportunities for investors:
Investment-Grade Corporate Bonds: Higher credit quality makes them potentially less vulnerable to increasing interest rates. Intermediate Bonds (2-10 Years): Allow investors to lock in higher rates.
Both types of bonds focus on quality and capturing higher yields when faced with challenging market conditions.
Finding the Upside
Much of the volatility seen in the banking sector was due to banks buying bonds during the pandemic—or even earlier—at a time when interest rates were historically low. Since then, rates have climbed considerably. Should rates moderate or stop increasing, this may present better market conditions for bonds. In this way, today’s steep discount in bond markets may present an attractive opportunity for price appreciation. At the same time, investors can potentially lock in strong yields as inflation may subside in the coming years ahead. Learn more about bond investing strategies with New York Life Investments.