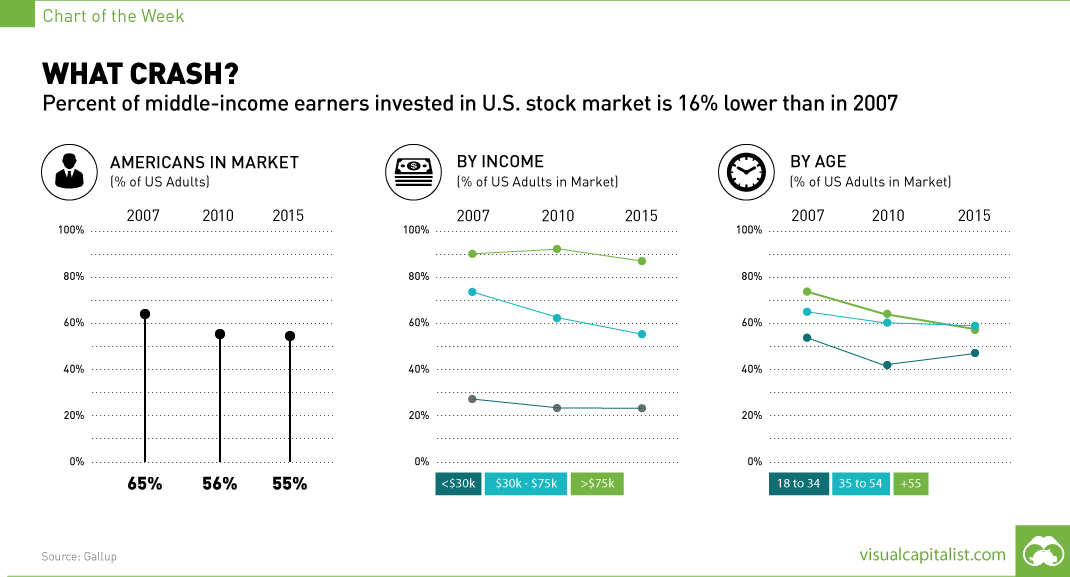
What Crash? [Chart]
Number of Middle-Income Earners Invested in Stock Market Drops by 16% Since 2007
The Chart of the Week is a weekly Visual Capitalist feature on Fridays. Over the last six years, with some help of the loosest monetary policy in history, the S&P 500 tripled in value from its lows during the Financial Crisis. Then in the last week, U.S. markets have been up and down like a roller coaster with surprising daily movements of historical proportions in both directions. Currently, at our time of publication, the DJIA is down -7% year-to-date. While the majority of investors are familiar with the above story, this time there are millions of fewer people along for the ride. And most of those that sat this one out are middle or lower income earners. Several polls tell the same story, which is that the number of Americans invested in the stock market has decreased significantly since 2007, the year before the Financial Crisis. In a series of Gallup polls, which are what we use for today’s chart, respondents were asked the following question: “Do you, personally, or jointly with a spouse, have any money invested in the stock market right now — either in an individual stock, a stock mutual fund, or in a self-directed 401(k) or IRA?” The total number of adults invested in the market has decreased from 65% (2007) to 55% (today). More alarmingly, it is people in the lower and middle income classes that make up the vast majority of this drop. For people making between $30k and $75k per year, the percentage of those invested has decreased from 72% to 56%. For those making less than $30k, it decreased from 28% to 21%. The folks that make over $75k per year? The percentage is close to the same, going from 90% to 88% – likely the result of some baby boomers retiring or focusing on fixed income securities in their later years. Going back further in the data, it actually turns out that the total amount of people invested in the markets is lower than virtually any time in the last two decades. Part of this is because of recent stagnation in wages, and another part is related to the rising distrust in the financial system itself. In our view, part of the problem is also that policies such as quantitative easing, zero interest-rates, and bank bailouts tend to help those out that are closer to the top of the food chain. Inflating asset bubbles help the people that own such assets, and low rates give well-off people access to even more capital to invest with. However, for the middle and lower income earners that rely on regular paychecks to accumulate capital, these same policies encourage consumption and indebtedness. Lower earners do not get to see their house or stock portfolio sail in growth because they do not own them. They also rely more on credit cards, which have only dropped from 14.5% to 13% in average rates. So don’t be surprised this weekend when your neighbor is unaware of the stock market mayhem over the last week. The majority of people in middle and lower income classes didn’t experience it.
on Today’s chart measures the extent to which 41 major economies are reopening, by plotting two metrics for each country: the mobility rate and the COVID-19 recovery rate: Data for the first measure comes from Google’s COVID-19 Community Mobility Reports, which relies on aggregated, anonymous location history data from individuals. Note that China does not show up in the graphic as the government bans Google services. COVID-19 recovery rates rely on values from CoronaTracker, using aggregated information from multiple global and governmental databases such as WHO and CDC.
Reopening Economies, One Step at a Time
In general, the higher the mobility rate, the more economic activity this signifies. In most cases, mobility rate also correlates with a higher rate of recovered people in the population. Here’s how these countries fare based on the above metrics. Mobility data as of May 21, 2020 (Latest available). COVID-19 case data as of May 29, 2020. In the main scatterplot visualization, we’ve taken things a step further, assigning these countries into four distinct quadrants:
1. High Mobility, High Recovery
High recovery rates are resulting in lifted restrictions for countries in this quadrant, and people are steadily returning to work. New Zealand has earned praise for its early and effective pandemic response, allowing it to curtail the total number of cases. This has resulted in a 98% recovery rate, the highest of all countries. After almost 50 days of lockdown, the government is recommending a flexible four-day work week to boost the economy back up.
2. High Mobility, Low Recovery
Despite low COVID-19 related recoveries, mobility rates of countries in this quadrant remain higher than average. Some countries have loosened lockdown measures, while others did not have strict measures in place to begin with. Brazil is an interesting case study to consider here. After deferring lockdown decisions to state and local levels, the country is now averaging the highest number of daily cases out of any country. On May 28th, for example, the country had 24,151 new cases and 1,067 new deaths.
3. Low Mobility, High Recovery
Countries in this quadrant are playing it safe, and holding off on reopening their economies until the population has fully recovered. Italy, the once-epicenter for the crisis in Europe is understandably wary of cases rising back up to critical levels. As a result, it has opted to keep its activity to a minimum to try and boost the 65% recovery rate, even as it slowly emerges from over 10 weeks of lockdown.
4. Low Mobility, Low Recovery
Last but not least, people in these countries are cautiously remaining indoors as their governments continue to work on crisis response. With a low 0.05% recovery rate, the United Kingdom has no immediate plans to reopen. A two-week lag time in reporting discharged patients from NHS services may also be contributing to this low number. Although new cases are leveling off, the country has the highest coronavirus-caused death toll across Europe. The U.S. also sits in this quadrant with over 1.7 million cases and counting. Recently, some states have opted to ease restrictions on social and business activity, which could potentially result in case numbers climbing back up. Over in Sweden, a controversial herd immunity strategy meant that the country continued business as usual amid the rest of Europe’s heightened regulations. Sweden’s COVID-19 recovery rate sits at only 13.9%, and the country’s -93% mobility rate implies that people have been taking their own precautions.
COVID-19’s Impact on the Future
It’s important to note that a “second wave” of new cases could upend plans to reopen economies. As countries reckon with these competing risks of health and economic activity, there is no clear answer around the right path to take. COVID-19 is a catalyst for an entirely different future, but interestingly, it’s one that has been in the works for a while. —Carmen Reinhart, incoming Chief Economist for the World Bank Will there be any chance of returning to “normal” as we know it?