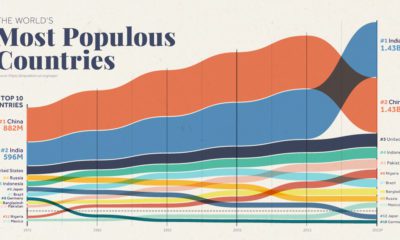
Today’s data visualization comes to us from Reddit user /r/mythicquale and it shows the population growth of every country using data and projections from the United Nations population division. The graph is on a logarithmic scale, which ultimately groups together most growth rates even though they would be much further apart on a linear scale. This means the places outside of the middle range are the true outliers, gaining or losing many multiples of their original populations. These are the stories that are worth looking at in more depth.
World Population Growth Outliers
How the population grows in any particular country is a function of fertility, mortality, and migration rates, and these outliers each have something anomalous happening at least one of these factors. Montserrat In 1995, a previously dormant volcano erupted in this British Overseas Territory in the Caribbean, destroying the island’s capital city of Plymouth. People evacuated, mostly fleeing to the United Kingdom, and the population of the island dropped by two-thirds over the period of five years. Interestingly, Plymouth is still listed as the territory’s capital city today, making it the only capital city of a political jurisdiction that is completely abandoned. U.A.E. Dubai was once a fishing village, but now it’s an international real estate hub. Abu Dhabi had just 25,000 people in 1960, and today it’s a metropolis of almost 2 million people.
Oil wealth and significant investment is one side of the story, but the influx of foreign workers is an even bigger one. In fact, U.A.E. citizens only make up 11.5% of the population, and the rest (88.5%) is made of workers mostly from South Asia. It’s also worth mentioning that immigrant labor in the U.A.E. has been the subject of scrutiny internationally, as there have been instances of human rights violations and accusations of forced labor. Qatar Qatar is another Middle Eastern country that has shot up in population, and it carries a similar story to the United Arab Emirates. Only about 12% of the population is Qatari, and the rest consists of migrant works mostly from South Asia. Qatar, which has the highest GDP per capita in the world, also has faced similar allegations as the U.A.E. regarding the use of forced labor. Back in 1950, Qatar’s population was just 50,000, but today the country boasts 2.6 million people. on Last year, stock and bond returns tumbled after the Federal Reserve hiked interest rates at the fastest speed in 40 years. It was the first time in decades that both asset classes posted negative annual investment returns in tandem. Over four decades, this has happened 2.4% of the time across any 12-month rolling period. To look at how various stock and bond asset allocations have performed over history—and their broader correlations—the above graphic charts their best, worst, and average returns, using data from Vanguard.
How Has Asset Allocation Impacted Returns?
Based on data between 1926 and 2019, the table below looks at the spectrum of market returns of different asset allocations:
We can see that a portfolio made entirely of stocks returned 10.3% on average, the highest across all asset allocations. Of course, this came with wider return variance, hitting an annual low of -43% and a high of 54%.
A traditional 60/40 portfolio—which has lost its luster in recent years as low interest rates have led to lower bond returns—saw an average historical return of 8.8%. As interest rates have climbed in recent years, this may widen its appeal once again as bond returns may rise.
Meanwhile, a 100% bond portfolio averaged 5.3% in annual returns over the period. Bonds typically serve as a hedge against portfolio losses thanks to their typically negative historical correlation to stocks.
A Closer Look at Historical Correlations
To understand how 2022 was an outlier in terms of asset correlations we can look at the graphic below:
The last time stocks and bonds moved together in a negative direction was in 1969. At the time, inflation was accelerating and the Fed was hiking interest rates to cool rising costs. In fact, historically, when inflation surges, stocks and bonds have often moved in similar directions. Underscoring this divergence is real interest rate volatility. When real interest rates are a driving force in the market, as we have seen in the last year, it hurts both stock and bond returns. This is because higher interest rates can reduce the future cash flows of these investments. Adding another layer is the level of risk appetite among investors. When the economic outlook is uncertain and interest rate volatility is high, investors are more likely to take risk off their portfolios and demand higher returns for taking on higher risk. This can push down equity and bond prices. On the other hand, if the economic outlook is positive, investors may be willing to take on more risk, in turn potentially boosting equity prices.
Current Investment Returns in Context
Today, financial markets are seeing sharp swings as the ripple effects of higher interest rates are sinking in. For investors, historical data provides insight on long-term asset allocation trends. Over the last century, cycles of high interest rates have come and gone. Both equity and bond investment returns have been resilient for investors who stay the course.