As COVID-19 continues to spread around the country leaving economic upheaval in its wake, many economic indicators are trending in undesirable ways. The graphic above is a snapshot of the overall health of the economy at this pivotal moment in time.
The Big Picture
To put this quarter’s 9.5% drop into perspective, it helps to look back in history. Since record keeping began in 1947, quarterly GDP had never exceeded even a 3% drop (non-annualized). Here are just a few of the problems currently plaguing the economy: Employment: Well over 50 million people are still out of the workforce as businesses shutter permanently and restrictions continue in many parts of the country. New unemployment claims have now exceeded 1 million for 19 consecutive weeks. Consumer Spending: This makes up more than two-thirds of the U.S. economy, and it sank by the sharpest rate in April—declining by 12.6%. The weekly payments of $600 provided through the CARES Act helped bolster household income, partially offsetting steeper losses. However, the payments expired July 31, and may not be renewed as an initiative. Monetary Policy: Trillions of dollars have been borrowed to counter the crisis, money supply (M2) has rapidly risen, and central bank balance sheets are shattering records. Despite the injection of money into the system, inflation has dropped to almost zero–well below the Fed’s ideal 2% rate–signalling deflationary pressure on the economy.
Bright Spots
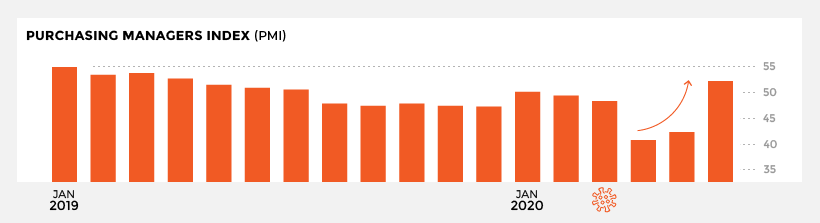
Despite the significant challenges facing the American economy, there are some areas that are showing signs of recovery. S&P 500: The flagship index is the most prominent positive, recording its best quarter in over two decades. Reaching a high-water mark in June, the index shot up over 25% over the second quarter. Federal stimulus packages stoked optimism in the markets, with the Fed at one point purchasing $41 billion in financial assets daily. Purchasing Managers’ Index (PMI): Widely seen as a leading business indicator, the PMI is also rebounding. Manufacturing output stabilized as production facilities slowly reopened. As a result, an expansionary manufacturing cycle is anticipated to begin.
What’s Next?
Bright spots aside, COVID-19 is set to become America’s third most common cause of death (after accidents). With an infection curve that remains stubbornly unflattened, it isn’t just the public that’s at risk–the economy may find itself on life support as well. on Last year, stock and bond returns tumbled after the Federal Reserve hiked interest rates at the fastest speed in 40 years. It was the first time in decades that both asset classes posted negative annual investment returns in tandem. Over four decades, this has happened 2.4% of the time across any 12-month rolling period. To look at how various stock and bond asset allocations have performed over history—and their broader correlations—the above graphic charts their best, worst, and average returns, using data from Vanguard.
How Has Asset Allocation Impacted Returns?
Based on data between 1926 and 2019, the table below looks at the spectrum of market returns of different asset allocations:
We can see that a portfolio made entirely of stocks returned 10.3% on average, the highest across all asset allocations. Of course, this came with wider return variance, hitting an annual low of -43% and a high of 54%.
A traditional 60/40 portfolio—which has lost its luster in recent years as low interest rates have led to lower bond returns—saw an average historical return of 8.8%. As interest rates have climbed in recent years, this may widen its appeal once again as bond returns may rise.
Meanwhile, a 100% bond portfolio averaged 5.3% in annual returns over the period. Bonds typically serve as a hedge against portfolio losses thanks to their typically negative historical correlation to stocks.
A Closer Look at Historical Correlations
To understand how 2022 was an outlier in terms of asset correlations we can look at the graphic below:
The last time stocks and bonds moved together in a negative direction was in 1969. At the time, inflation was accelerating and the Fed was hiking interest rates to cool rising costs. In fact, historically, when inflation surges, stocks and bonds have often moved in similar directions. Underscoring this divergence is real interest rate volatility. When real interest rates are a driving force in the market, as we have seen in the last year, it hurts both stock and bond returns. This is because higher interest rates can reduce the future cash flows of these investments. Adding another layer is the level of risk appetite among investors. When the economic outlook is uncertain and interest rate volatility is high, investors are more likely to take risk off their portfolios and demand higher returns for taking on higher risk. This can push down equity and bond prices. On the other hand, if the economic outlook is positive, investors may be willing to take on more risk, in turn potentially boosting equity prices.
Current Investment Returns in Context
Today, financial markets are seeing sharp swings as the ripple effects of higher interest rates are sinking in. For investors, historical data provides insight on long-term asset allocation trends. Over the last century, cycles of high interest rates have come and gone. Both equity and bond investment returns have been resilient for investors who stay the course.