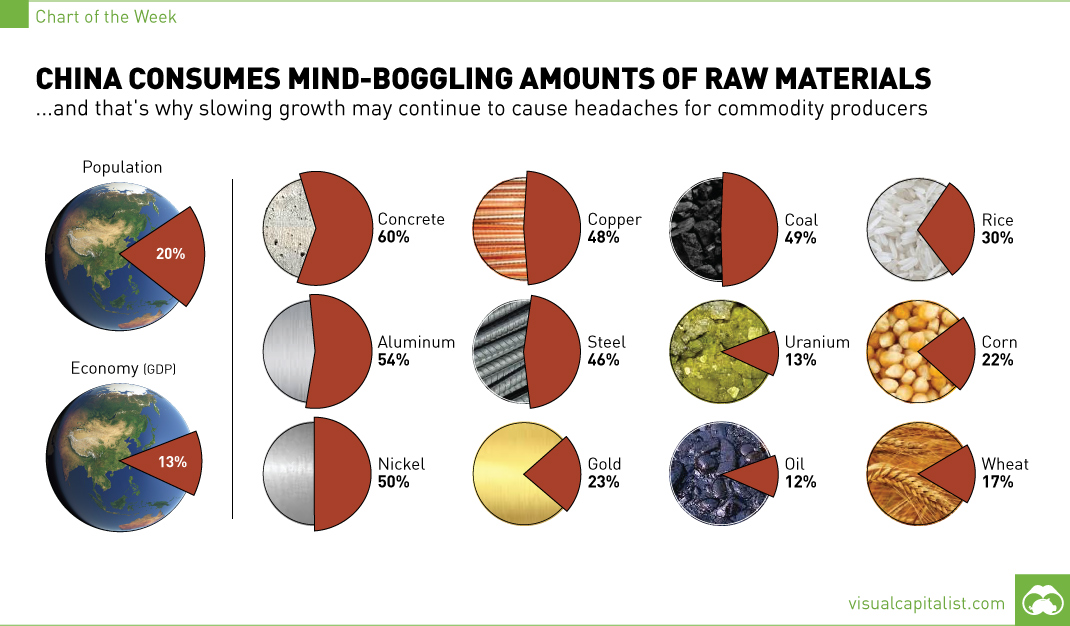
China Consumes Mind-Boggling Amounts of Raw Materials [Chart]
The Chart of the Week is a weekly Visual Capitalist feature on Fridays. Over the last 20 years, the world economy has relied on the Chinese economic growth engine more than it would like to admit. The 1.4 billion people living in the world’s most populous country account for 13% of global GDP, which is significant no matter how it is interpreted. However, in the commodity sector, China has another magnitude of importance. The fact is that China consumes mind-bending amounts of materials, energy, and food. That’s why the prospect of slowing Chinese growth is likely to continue as a source of nightmares for investors focused on the commodity sector. The country consumes a big proportion of the world’s materials used in infrastructure. It consumes 54% of aluminum, 48% of copper, 50% of nickel, 45% of all steel, and 60% of concrete. In fact, the country has consumed more concrete in the last three years than the United States did in all of the 20th century. China is also prolific in accumulating precious metals – the country buys or mines 23% of gold and 15% of the world’s silver supply. With many mouths to feed, China also needs large amounts of food. About 30% of rice, 22% of corn, and 17% of wheat gets eaten by the Chinese. Lastly, the country is no hack in terms of burning fuel either. Notably, China uses 49% of coal for power generation as well as metallurgical processes in making steel. It also uses 13% of the world’s uranium and 12% of all oil. These facts really hit home to show how important China is to the global consumption of raw materials. If China is unable to navigate its tricky transition to a consumer-driven economy and has a “hard landing”, it will be unlikely to see any growth in commodity prices triggered from the demand side. That said, supply is equally as important and it tells a different story: with companies like Glencore cutting copper production by 400,000 tons to better service its massive debt, the floor for commodities could be in.
on Today’s chart measures the extent to which 41 major economies are reopening, by plotting two metrics for each country: the mobility rate and the COVID-19 recovery rate: Data for the first measure comes from Google’s COVID-19 Community Mobility Reports, which relies on aggregated, anonymous location history data from individuals. Note that China does not show up in the graphic as the government bans Google services. COVID-19 recovery rates rely on values from CoronaTracker, using aggregated information from multiple global and governmental databases such as WHO and CDC.
Reopening Economies, One Step at a Time
In general, the higher the mobility rate, the more economic activity this signifies. In most cases, mobility rate also correlates with a higher rate of recovered people in the population. Here’s how these countries fare based on the above metrics. Mobility data as of May 21, 2020 (Latest available). COVID-19 case data as of May 29, 2020. In the main scatterplot visualization, we’ve taken things a step further, assigning these countries into four distinct quadrants:
1. High Mobility, High Recovery
High recovery rates are resulting in lifted restrictions for countries in this quadrant, and people are steadily returning to work. New Zealand has earned praise for its early and effective pandemic response, allowing it to curtail the total number of cases. This has resulted in a 98% recovery rate, the highest of all countries. After almost 50 days of lockdown, the government is recommending a flexible four-day work week to boost the economy back up.
2. High Mobility, Low Recovery
Despite low COVID-19 related recoveries, mobility rates of countries in this quadrant remain higher than average. Some countries have loosened lockdown measures, while others did not have strict measures in place to begin with. Brazil is an interesting case study to consider here. After deferring lockdown decisions to state and local levels, the country is now averaging the highest number of daily cases out of any country. On May 28th, for example, the country had 24,151 new cases and 1,067 new deaths.
3. Low Mobility, High Recovery
Countries in this quadrant are playing it safe, and holding off on reopening their economies until the population has fully recovered. Italy, the once-epicenter for the crisis in Europe is understandably wary of cases rising back up to critical levels. As a result, it has opted to keep its activity to a minimum to try and boost the 65% recovery rate, even as it slowly emerges from over 10 weeks of lockdown.
4. Low Mobility, Low Recovery
Last but not least, people in these countries are cautiously remaining indoors as their governments continue to work on crisis response. With a low 0.05% recovery rate, the United Kingdom has no immediate plans to reopen. A two-week lag time in reporting discharged patients from NHS services may also be contributing to this low number. Although new cases are leveling off, the country has the highest coronavirus-caused death toll across Europe. The U.S. also sits in this quadrant with over 1.7 million cases and counting. Recently, some states have opted to ease restrictions on social and business activity, which could potentially result in case numbers climbing back up. Over in Sweden, a controversial herd immunity strategy meant that the country continued business as usual amid the rest of Europe’s heightened regulations. Sweden’s COVID-19 recovery rate sits at only 13.9%, and the country’s -93% mobility rate implies that people have been taking their own precautions.
COVID-19’s Impact on the Future
It’s important to note that a “second wave” of new cases could upend plans to reopen economies. As countries reckon with these competing risks of health and economic activity, there is no clear answer around the right path to take. COVID-19 is a catalyst for an entirely different future, but interestingly, it’s one that has been in the works for a while. —Carmen Reinhart, incoming Chief Economist for the World Bank Will there be any chance of returning to “normal” as we know it?