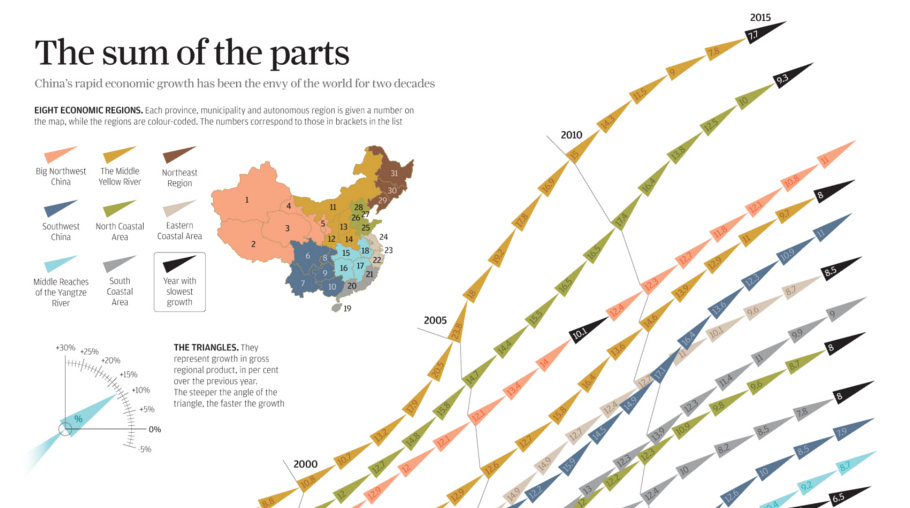
Geographically vast countries such as the United States or Canada have incredible diversity within their borders. Every part of the country appears unique, as the distribution of population, culture, geographical features, natural resources, and regional industries vary from place to place. Think of the differences within the U.S. alone: Silicon Valley is known for its technology and dry weather, while New York City is diverse and busy financial hub. Detroit and the other cities situated in the Great Lake States are all known for manufacturing. Meanwhile, Alaska is a center for natural resources, providing the rest of the country with much of its energy, fishing, and metal resources. China is not much different in this regard, and today’s infographic shows the growth of individual provinces, municipalities, and other administrative areas within the country over the last 20 years.
Specific Growth Stories in China
There are several growth stories that stand out. While many contain similar themes, each is very unique in its own right and worth studying further. Here are just some of the rapidly growing places in China that caught our eye: Inner Mongolia Inner Mongolia, the region of China that borders the country of Mongolia on both the south and east, is extremely rich in natural resources. Making up 12% of the country’s land mass, the region holds 25% of the world’s coal reserves and also produces rare earths, natural gas, and other commodities. Inner Mongolia has the highest installed wind power capacity in China, and the region is also the country’s largest livestock producer. Inner Mongolia’s economy averaged just under 20% growth per year in the years from 2005-2010. Tianjin Tianjin is the primary industrial, commercial and economic center of North China with 15.2 million people. It’s a hub for high-tech manufacturing and logistics, producing many of the cell phone parts used throughout the world. Manufacturing makes up 47.4% of the municipality’s industrial sector, and Tianjin is one of China’s largest port cities. Tianjin’s economy continued to accelerate from 2000 (10.8% growth) all the way to 2012 (16.4% growth) before starting to decline. The city is still growing faster than the rest of China, registering 9.3% growth in 2015. Tibet Tibet, known mainly as a center of Buddhism and the home of the currently exiled Dalai Lama, is a rapidly changing place. Despite a rich pastoral and nomadic tradition, Tibet is becoming more urban and diversified in terms of industry. Tibet’s GDP, which was only 327 million yuan in 1965, has soared to 92.08 billion yuan ($14.5 billion) in 2014. This is a 281-fold increase. Chongqing In 2014, heavy industry made up 74% of Chongqing’s gross industrial output. The sprawling megacity and surrounding area has 32 million people, and sits at the end of the mighty Yangtze River. Chongqing produces much of the country’s automobiles, military equipment, steel, and aluminum. Despite the national economy slowing to a 25-year low of 6.9% growth in 2015, Chongqing racked up 11% growth in the year. Original graphic by: SCMP on The good news is that the Federal Reserve, U.S. Treasury, and Federal Deposit Insurance Corporation are taking action to restore confidence and take the appropriate measures to help provide stability in the market. With this in mind, the above infographic from New York Life Investments looks at the factors that impact bonds, how different types of bonds have historically performed across market environments, and the current bond market volatility in a broader context.
Bond Market Returns
Bonds had a historic year in 2022, posting one of the worst returns ever recorded. As interest rates rose at the fastest pace in 40 years, it pushed bond prices lower due to their inverse relationship. In a rare year, bonds dropped 13%.
Source: FactSet, 01/02/2023.
Bond prices are only one part of a bond’s total return—the other looks at the income a bond provides. As interest rates have increased in the last year, it has driven higher bond yields in 2023.
Source: YCharts, 3/20/2023.
With this recent performance in mind, let’s look at some other key factors that impact the bond market.
Factors Impacting Bond Markets
Interest rates play a central role in bond market dynamics. This is because they affect a bond’s price. When rates are rising, existing bonds with lower rates are less valuable and prices decline. When rates are dropping, existing bonds with higher rates are more valuable and their prices rise. In March, the Federal Reserve raised rates 25 basis points to fall within the 4.75%-5.00% range, a level not seen since September 2007. Here are projections for where the federal funds rate is headed in 2023:
Federal Reserve Projection*: 5.1% Economist Projections**: 5.3%
*Based on median estimates in the March summary of quarterly economic projections.**Projections based on March 10-15 Bloomberg economist survey. Together, interest rates and the macroenvironment can have a positive or negative effect on bonds.
Positive
Here are three variables that may affect bond prices in a positive direction:
Lower Inflation: Reduces likelihood of interest rate hikes. Lower Interest Rates: When rates are falling, bond prices are typically higher. Recession: Can prompt a cut in interest rates, boosting bond prices.
Negative
On the other hand, here are variables that may negatively impact bond prices:
Higher Inflation: Can increase the likelihood of the Federal Reserve to raise interest rates. Rising Interest Rates: Interest rate hikes lead bond prices to fall. Weaker Fundamentals: When a bond’s credit risk gets worse, its price can drop. Credit risk indicates the chance of a default, the risk of a bond issuer not making interest payments within a given time period.
Bonds have been impacted by these negative factors since inflation started rising in March 2021.
Fixed Income Opportunities
Below, we show the types of bonds that have had the best performance during rising rates and recessions.
Source: Derek Horstmeyer, George Mason University 12/3/2022. As we can see, U.S. ultrashort bonds performed the best during rising rates. Mortgage bonds outperformed during recessions, averaging 11.4% returns, but with higher volatility. U.S. long-term bonds had 7.7% average returns, the best across all market conditions. In fact, they were also a close second during recessions. When rates are rising, ultrashort bonds allow investors to capture higher rates when they mature, often with lower historical volatility.
A Closer Look at Bond Market Volatility
While bond market volatility has jumped this year, current dislocations may provide investment opportunities. Bond dislocations allow investors to buy at lower prices, factoring in that the fundamental quality of the bond remains strong. With this in mind, here are two areas of the bond market that may provide opportunities for investors:
Investment-Grade Corporate Bonds: Higher credit quality makes them potentially less vulnerable to increasing interest rates. Intermediate Bonds (2-10 Years): Allow investors to lock in higher rates.
Both types of bonds focus on quality and capturing higher yields when faced with challenging market conditions.
Finding the Upside
Much of the volatility seen in the banking sector was due to banks buying bonds during the pandemic—or even earlier—at a time when interest rates were historically low. Since then, rates have climbed considerably. Should rates moderate or stop increasing, this may present better market conditions for bonds. In this way, today’s steep discount in bond markets may present an attractive opportunity for price appreciation. At the same time, investors can potentially lock in strong yields as inflation may subside in the coming years ahead. Learn more about bond investing strategies with New York Life Investments.