Every year, the average American takes home about $51,600 in personal income. Of course, what you make each year depends on factors like your job, work ethic, education, and personal circumstances – but it also varies significantly over geography.
The Geographical Wage Gap
Today’s chart uses data from the Brookings Institute, and it focuses on the geographical wage gap, or the difference in per capita income that exists between various U.S. regions. Interestingly, it’s a gap that has historically narrowed over time. Just after the Great Depression, income per capita in the Mideast was 50% higher than the average American, and roughly three times higher than in the Southeast. Over the next 50 years, this gap would continue to narrow until reaching its smallest differential by the mid-1980s. In the last couple of decades, however, the geographical wage gap has shown signs of a potential reversal: per capita incomes in New England, Mideast, and Far West have been increasing relative to the average American wage, while other regions are remaining more stagnant.
The Vitality Index
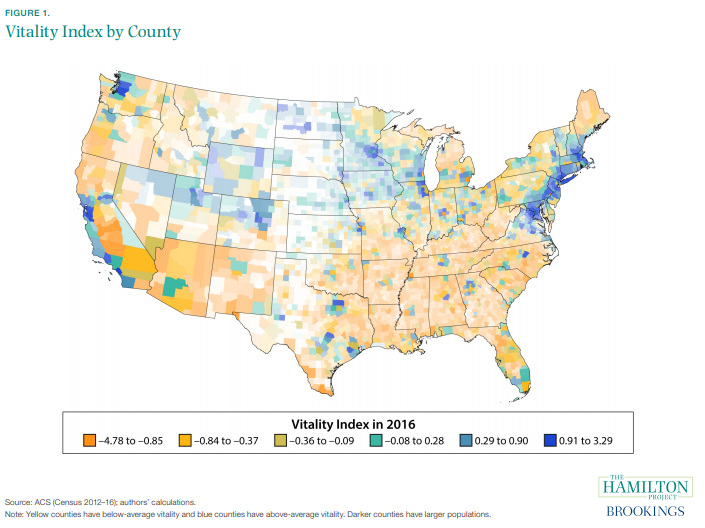
Wages are just one factor in measuring prosperity, and the Brookings Institute has attempted to create a more well-rounded approach to this with the Vitality Index. The Vitality Index is comprised of the following variables:
Median household income – 45% Poverty rate – 24% Life expectancy – 13% Prime-age employment-to-population ratio – 9% Housing vacancy rate – 5% Unemployment rate – 4%
The following map is directly from the aforementioned report, and it shows the Vitality Index by county, using recent data from the U.S. Census Bureau:
Which areas have seen the biggest increases and decreases in vitality? The Great Lakes region, which relies heavily on manufacturing, has seen the most significant drop between 1980-2016, while the Mideast has seen the biggest rise over that same 26 year period.
Cost of Living
One fair point of objection to the analysis of the Vitality Index – or any measure of economic differences between geographic regions – is that cost of living is not taken directly into account. Here is what the researchers had to say on this: It would be reasonable to adjust median household income for cost of living, but we opted to not do this for two reasons. First, cost-of-living estimates that are comparable across places are not available for 1980. Second, cost of living may vary for reasons that are directly related to the county vitality we seek to measure. For example, a place with stronger labor demand or better local public goods could attract in-migration that contributes to higher housing prices. Finally, cost of living may reflect the amenity value of a place, and not simply inflated prices for the same goods and services. No analysis is perfect, but the Vitality Index and historical data on per capita income are interesting to consider when framing any analysis on wages, prosperity, and economic inequality in America. on A lagging stock market dented these fortunes against high interest rates, energy shocks, and economic uncertainty. But some of the world’s billionaires have flourished in this environment, posting sky-high revenues in spite of inflationary pressures. With data from Forbes Real-Time Billionaires List, we feature a snapshot of the richest people in the world in 2023.
Luxury Mogul Takes Top Spot
The world’s richest person is France’s Bernard Arnault, the chief executive of LVMH.
With 75 brands, the luxury conglomerate owns Louis Vuitton, Christian Dior, and Tiffany. LVMH traces back to 1985, when Arnault cut his first major deal with the company by acquiring Christian Dior, a firm that was struggling with bankruptcy.
Fast-forward to today, and the company is seeing record profits despite challenging market conditions. Louis Vuitton, for instance, has doubled its sales in four years.
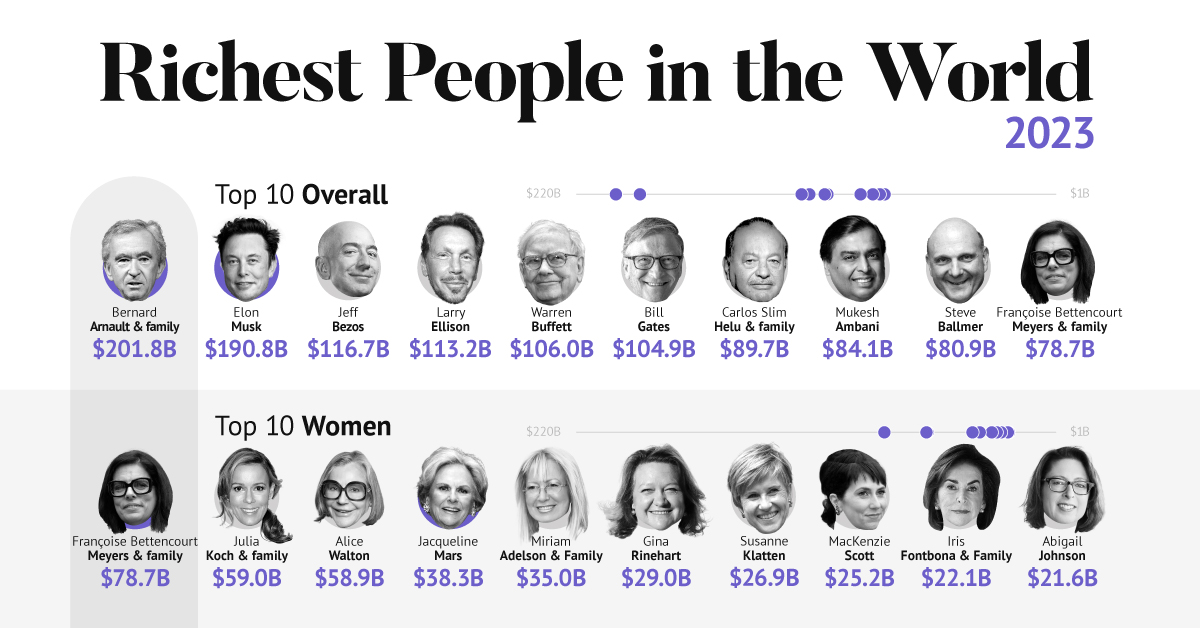
In the table below, we show the world’s 10 richest people with data as of February 27, 2023:
Elon Musk, the second-wealthiest person in the world has a net worth of $191 billion. In October, Musk took over Twitter in a $44 billion dollar deal, which has drawn criticism from investors. Many say it’s a distraction from Musk’s work with Tesla.
While Tesla shares have rebounded—after falling roughly 70% in 2022—Musk’s wealth still sits about 13% lower than in March of last year.
Third on the list is Jeff Bezos, followed by Larry Ellison. The latter of the two, who founded Oracle, owns 98% of the Hawaiian island of Lanai which he bought in 2012 for $300 million.
Fifth on the list is Warren Buffett. In his annual letter to shareholders, he discussed how Berkshire Hathaway reported record operating profits despite economic headwinds. The company outperformed the S&P 500 Index by about 22% in 2022.
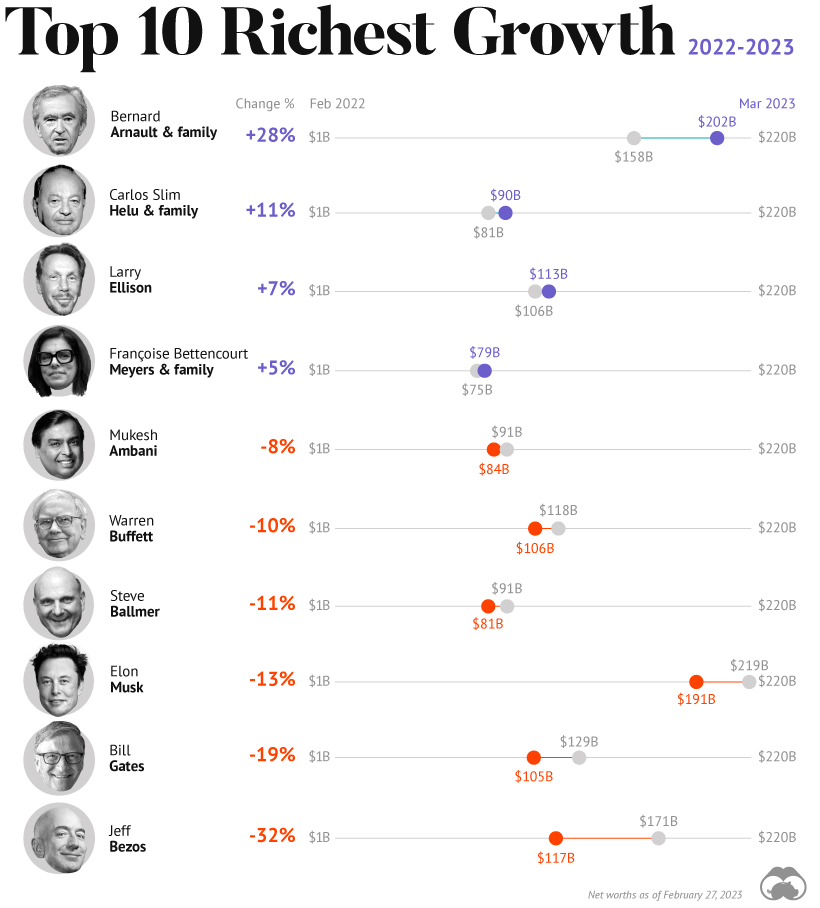
How Fortunes Have Changed
Given multiple economic crosscurrents, billionaire wealth has diverged over the last year. Since March 2022, just four of the top 10 richest in the world have seen their wealth increase. Two of these are European magnates, while Carlos Slim Helu runs the largest telecom firm in Latin America. In fact, a decade ago Slim was the richest person on the planet. Overall, as the tech sector saw dismal returns over the year, the top 10 tech billionaires lost almost $500 billion in combined wealth.
Recent Shakeups in Asia
Perhaps the most striking news for the world’s richest centers around Gautam Adani, formerly the richest person in Asia. In January, Hindenburg Research, a short-selling firm, released a report claiming that the Adani Group engaged in stock manipulation and fraud. Specifically, the alleged the firm used offshore accounts to launder money, artificially boost share prices, and hide losses. The Adani Group, which owns India’s largest ports—along with ports in Australia, Sri Lanka, and Israel—lost $100 billion in value in the span of a few weeks. Interestingly, very few Indian mutual funds hold significant shares in Adani Group, signaling a lack of confidence across India’s market, which was also cited in Hindenburg’s report. As a result, Mukesh Ambani has climbed to Asia’s top spot, controlling a $84 billion empire that spans from oil and gas and renewable energy to telecom. His conglomerate, Reliance Industries is the largest company by market cap in India.