Media coverage has reached a fever pitch, and keeping up with the news cycle can be daunting for anyone. To keep the voting public and interested onlookers informed, we’ve compiled nine key charts that can help in answering key questions that people will have today:
Who’ll win the U.S. presidential election? How could swing states flip? When will we know the election results? What are the stakes? What does the rest of the world think?
Let’s start with the biggest—and most challenging—of these topics first.
Who’ll Win the Election?
As the world learned in 2016, answering this question is not as simple as it looks—even when the poll results point to a clear victory.
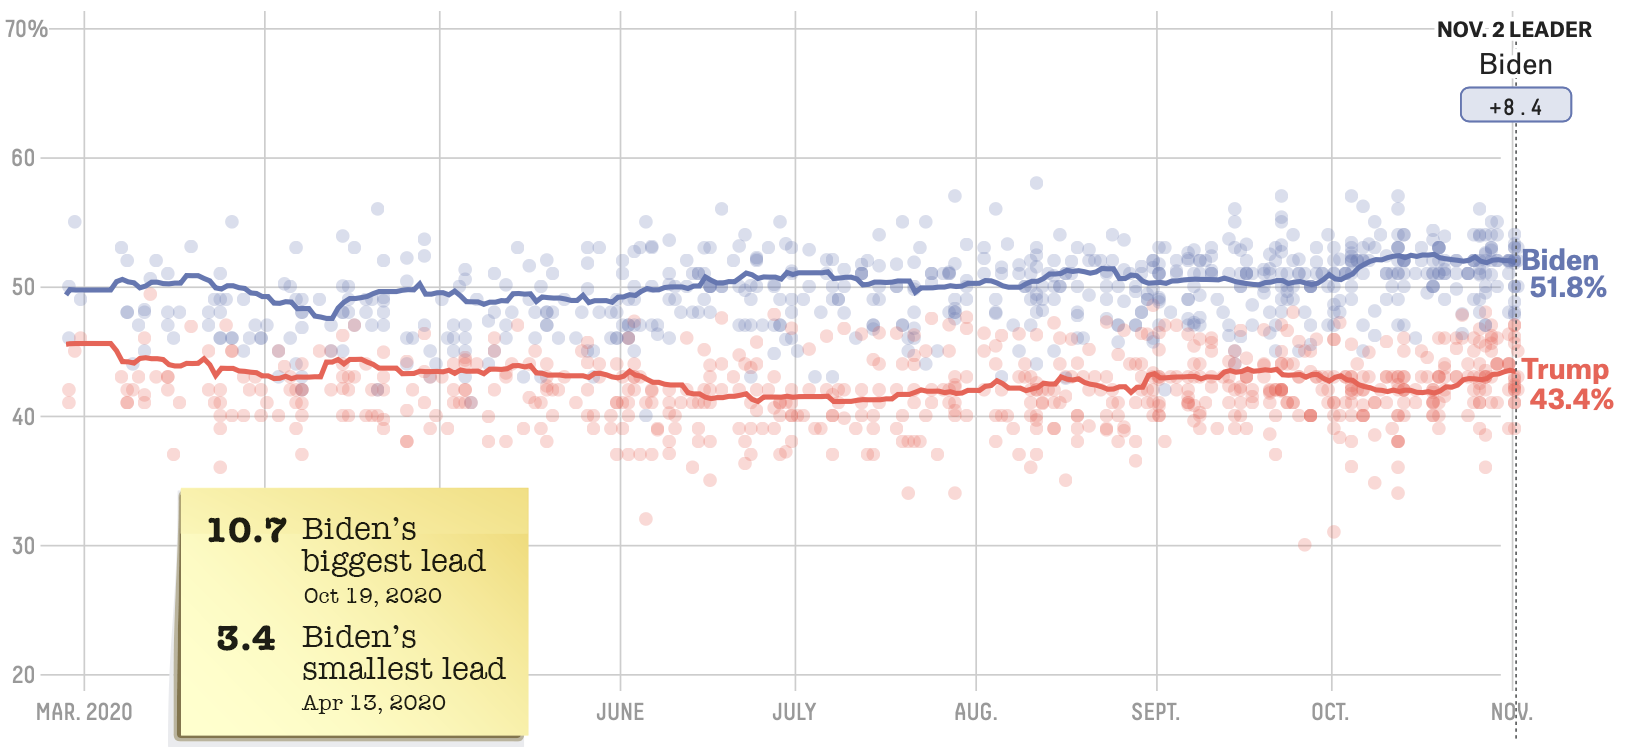
Chart #1: Biden remains the odds-on favorite
In 2020’s race, the poll results are once again stacked against President Trump. Here’s a look at who’s ahead in aggregated national polls:
Source: FiveThirtyEight Although this election cycle has been a wild ride, that volatility isn’t necessarily reflected in the polls. Over the past three months, Joe Biden’s lead in the national polls has not dipped below three percentage points.
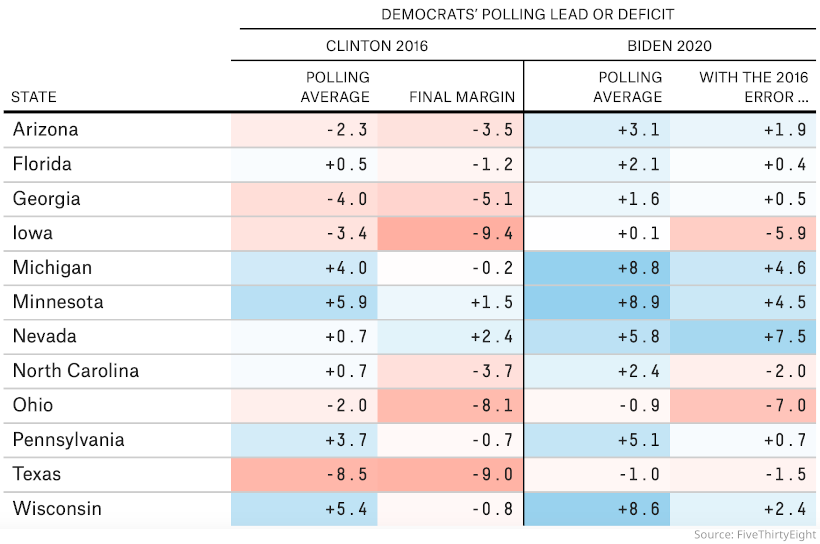
Chart #2: Viewing odds through a 2016 lens
That said, after the colossal miscalculation by the media and pollsters in 2016, many people are skeptical of the accuracy of polls. Luckily, there’s a way to look at predictions through a more skeptical lens. As this table from FiveThirtyEight demonstrates, even if the results are as wrong as in 2016, Joe Biden is still predicted to win.
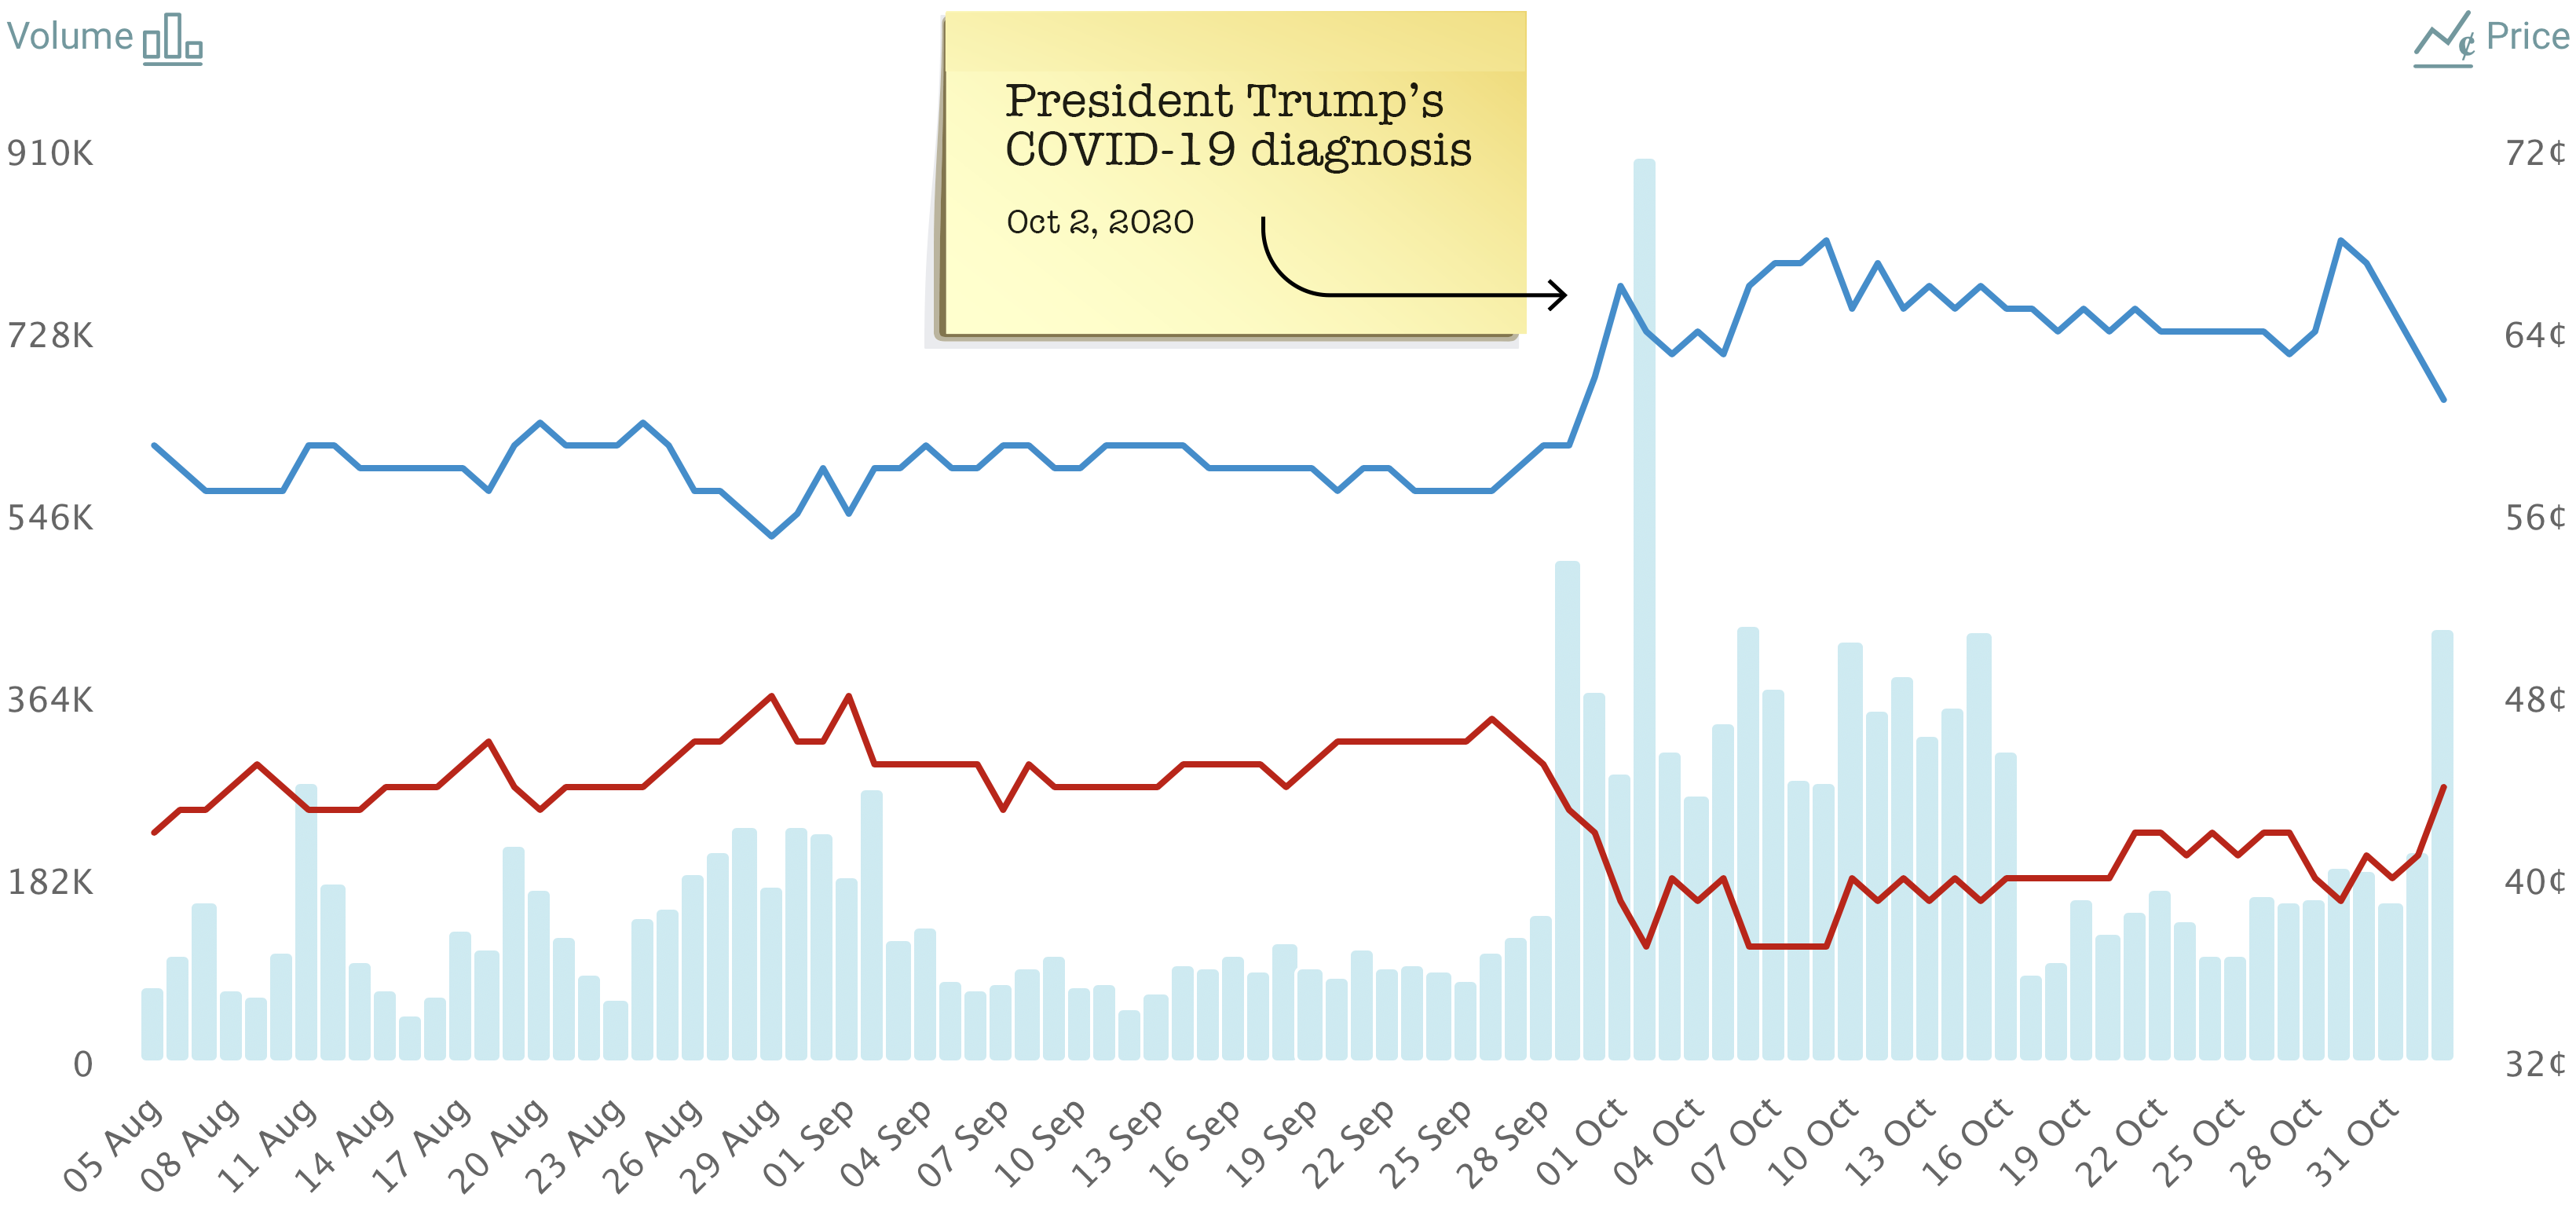
Chart #3: Betting markets also agree
Prediction markets are another way to try to gauge how the election could turn out. Traders on PredictIt are also leaning towards a Biden win on election day. President Trump’s COVID-19 diagnosis in early October served as a pivot point in that market.
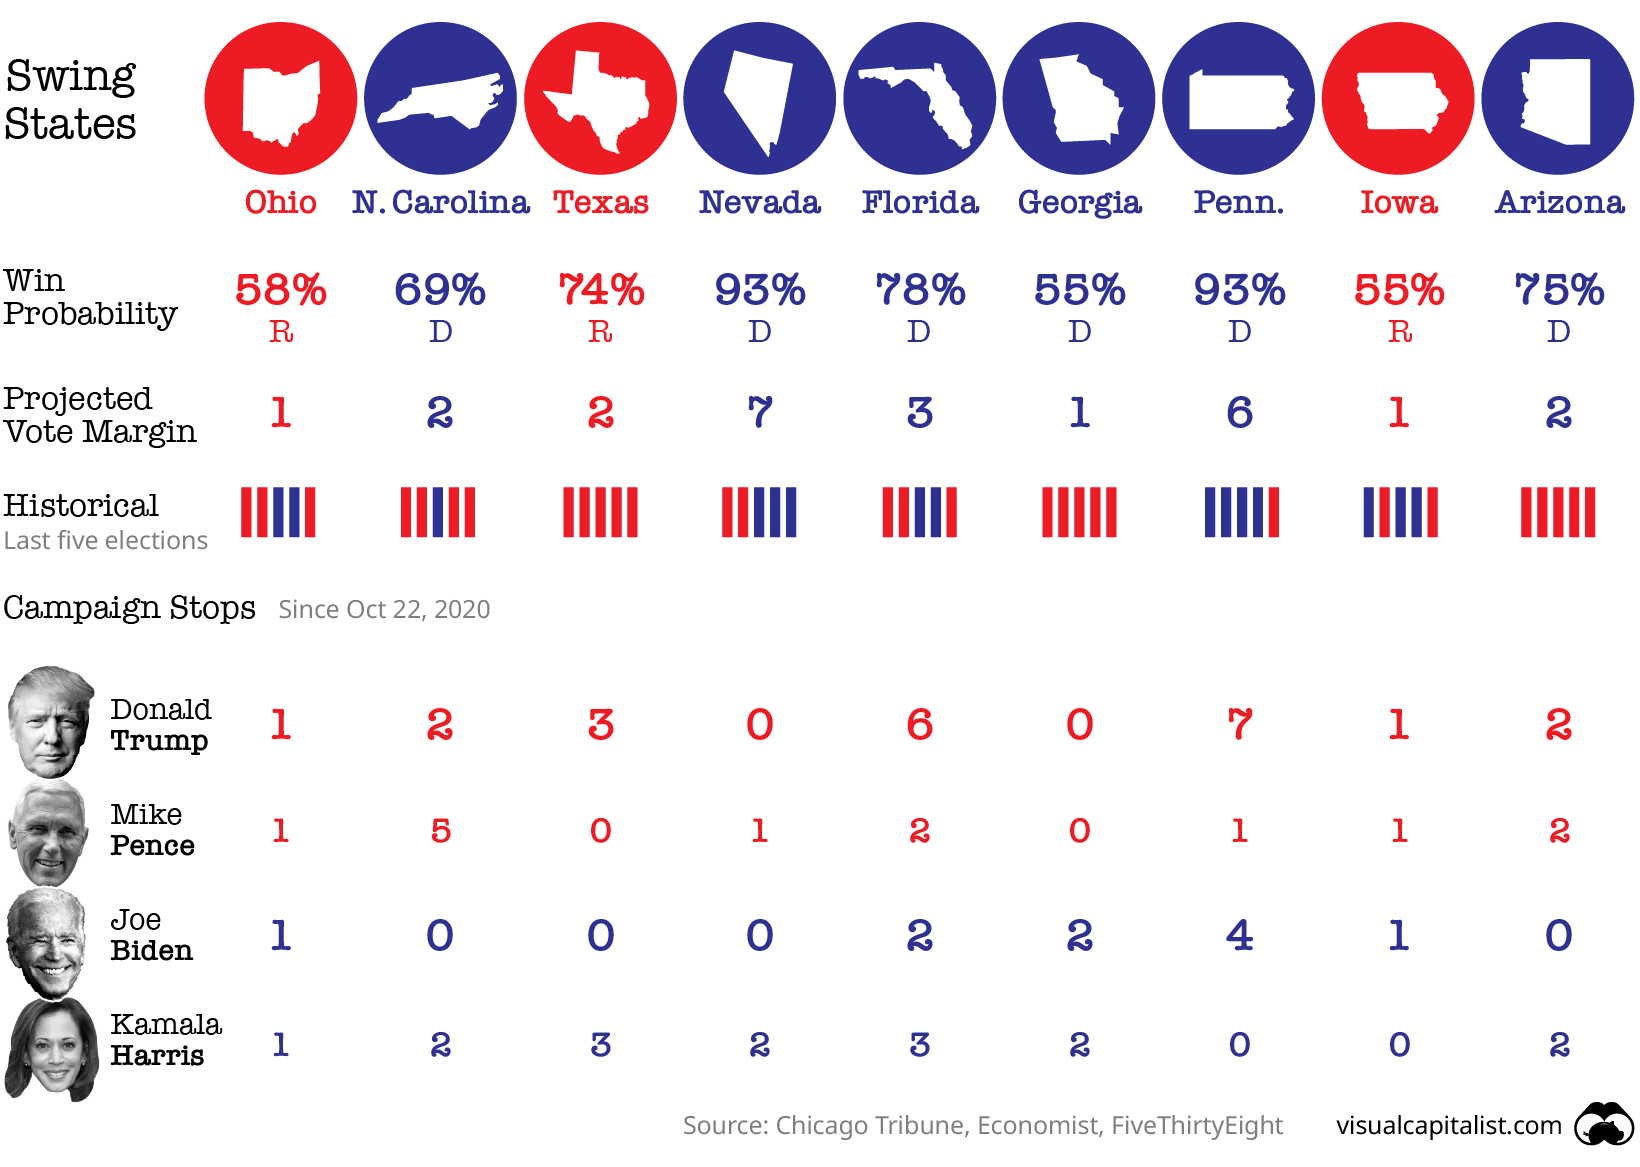
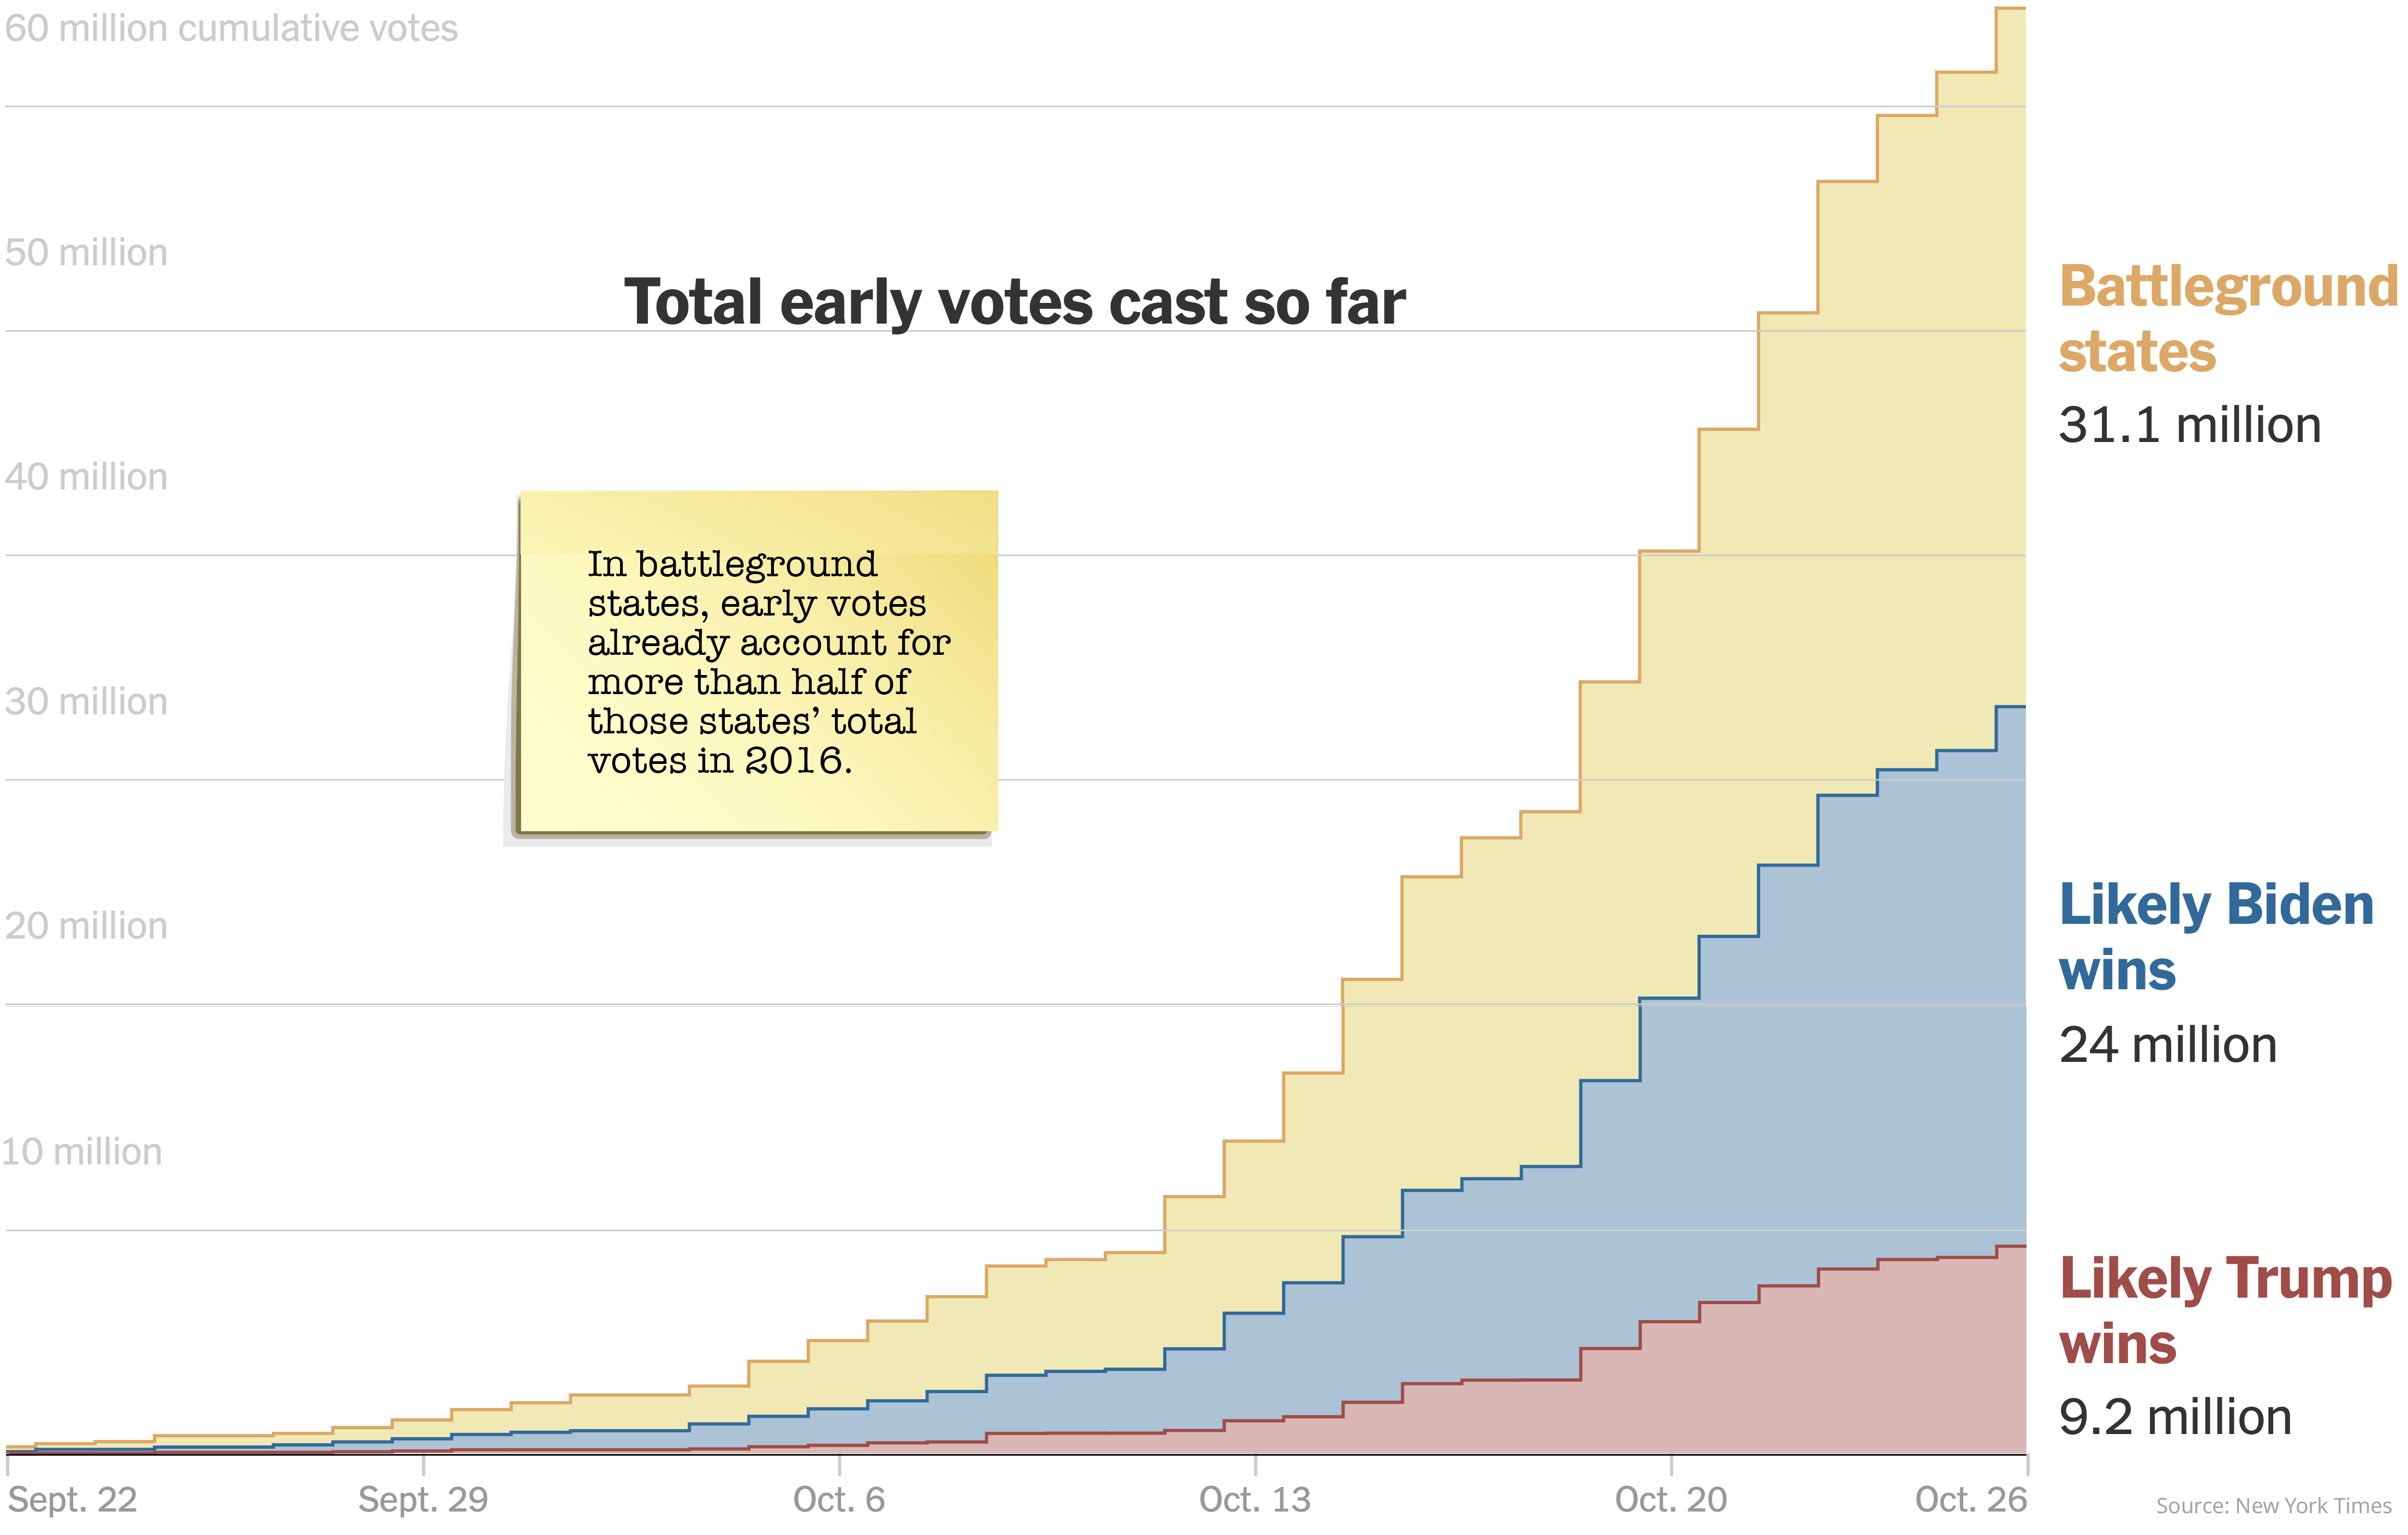
Chart #4: The Sultans of Swing
There are a few swing states which will be hotly contested, with the candidates focusing their final days of campaigning on these. Pennsylvania has received the most visits from both Trump and Biden since their last debate on October 22nd, with Trump visiting the state seven times and Biden stopping by four times.
Swing states have had strong early voting turnouts. In fact, the number of early voters in many swing states is already set to surpass the total number of voters they saw in the 2016 election. While Arizona and Georgia have voted red for the past five elections, early predictions point to these states possibly turning blue in 2020.
When Will We Know the Election Results?
While the result of the presidential election is typically known on the night of the election itself, this year could see delays due to the tight race and the amount of mail-in ballots. No matter what, state election disputes need to be settled before December 8th, the “safe-harbor deadline”. After this date, states run the risk of having Congress refuse to accept their electoral votes, with Congress also resolving any left over disputes. Each state’s electors then meet on December 14th in order to elect the president and vice-president. Depending on how that goes, this interactive election timeline by The Guardian looks at a few nightmare scenarios that the U.S. could get caught in.
Chart #5: Visualizing mail-in ballots so far
Mail-in ballots can slow down the election result due to late ballot deadlines and the pre-processing required for them to be counted. Expect to see a correlation between states with high mail-in ballot numbers and how long it takes them to call their result.
Ballot deadlines depend on the state, with some states accepting ballots up until November 23rd as long as they were postmarked by election day. While some states can start pre-processing ballots before election day, others can’t start until election day itself. Some counties (including some in swing state Pennsylvania) won’t be starting mail-in ballot counting until November 4th due to limited resources.
Why Are the Stakes So High?
Voters from both parties are heavily invested in who wins this election—a trend that’s been on the rise for years, coinciding with increasing amounts of political polarization.
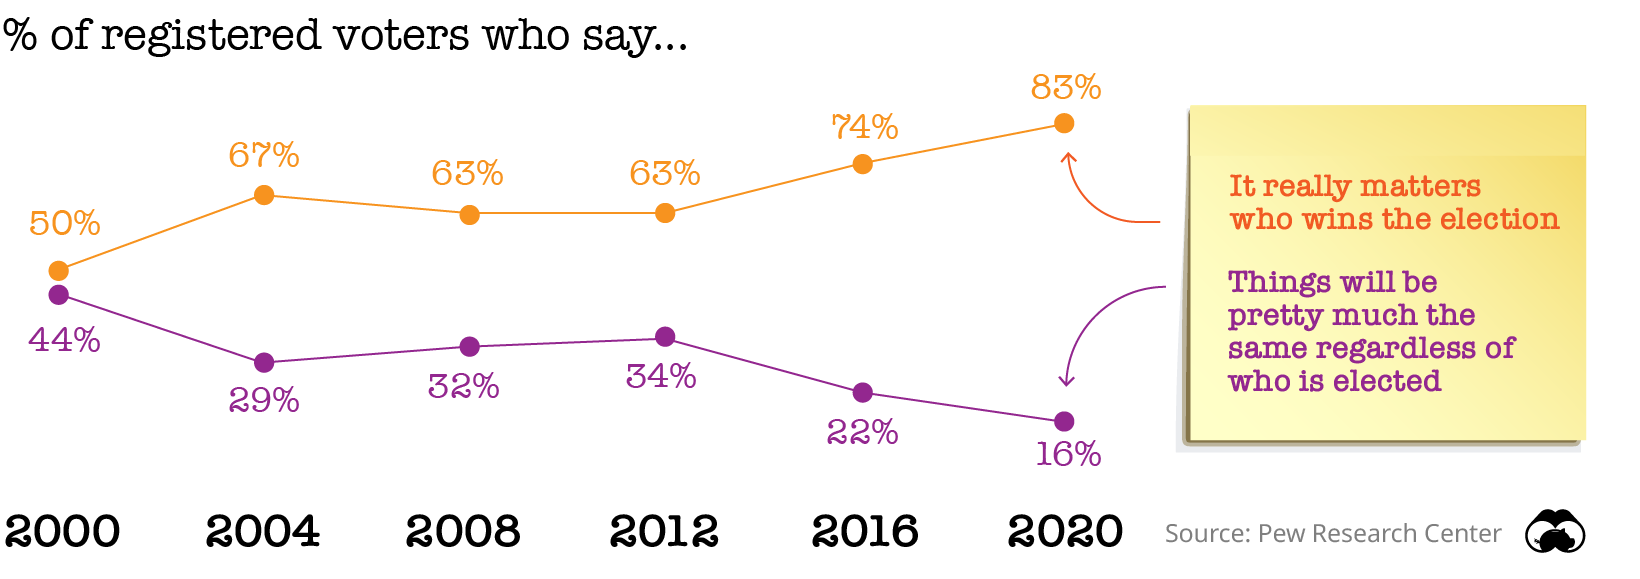
Chart #6: Voter apathy, no more
According to a recent survey by Pew Research Center, 83% of voters say it “really matters” who becomes the next president. In 2000, only 50% felt so strongly about the outcome of the election.
To be fair, this year is also unique given a global pandemic—and this has certainly weighed heavily on many voters, creating more urgency than normal. In fact, according to a survey conducted by Gallup in April 2020, 45% of Americans think Coronavirus/disease is the most important issue the country is currently facing.
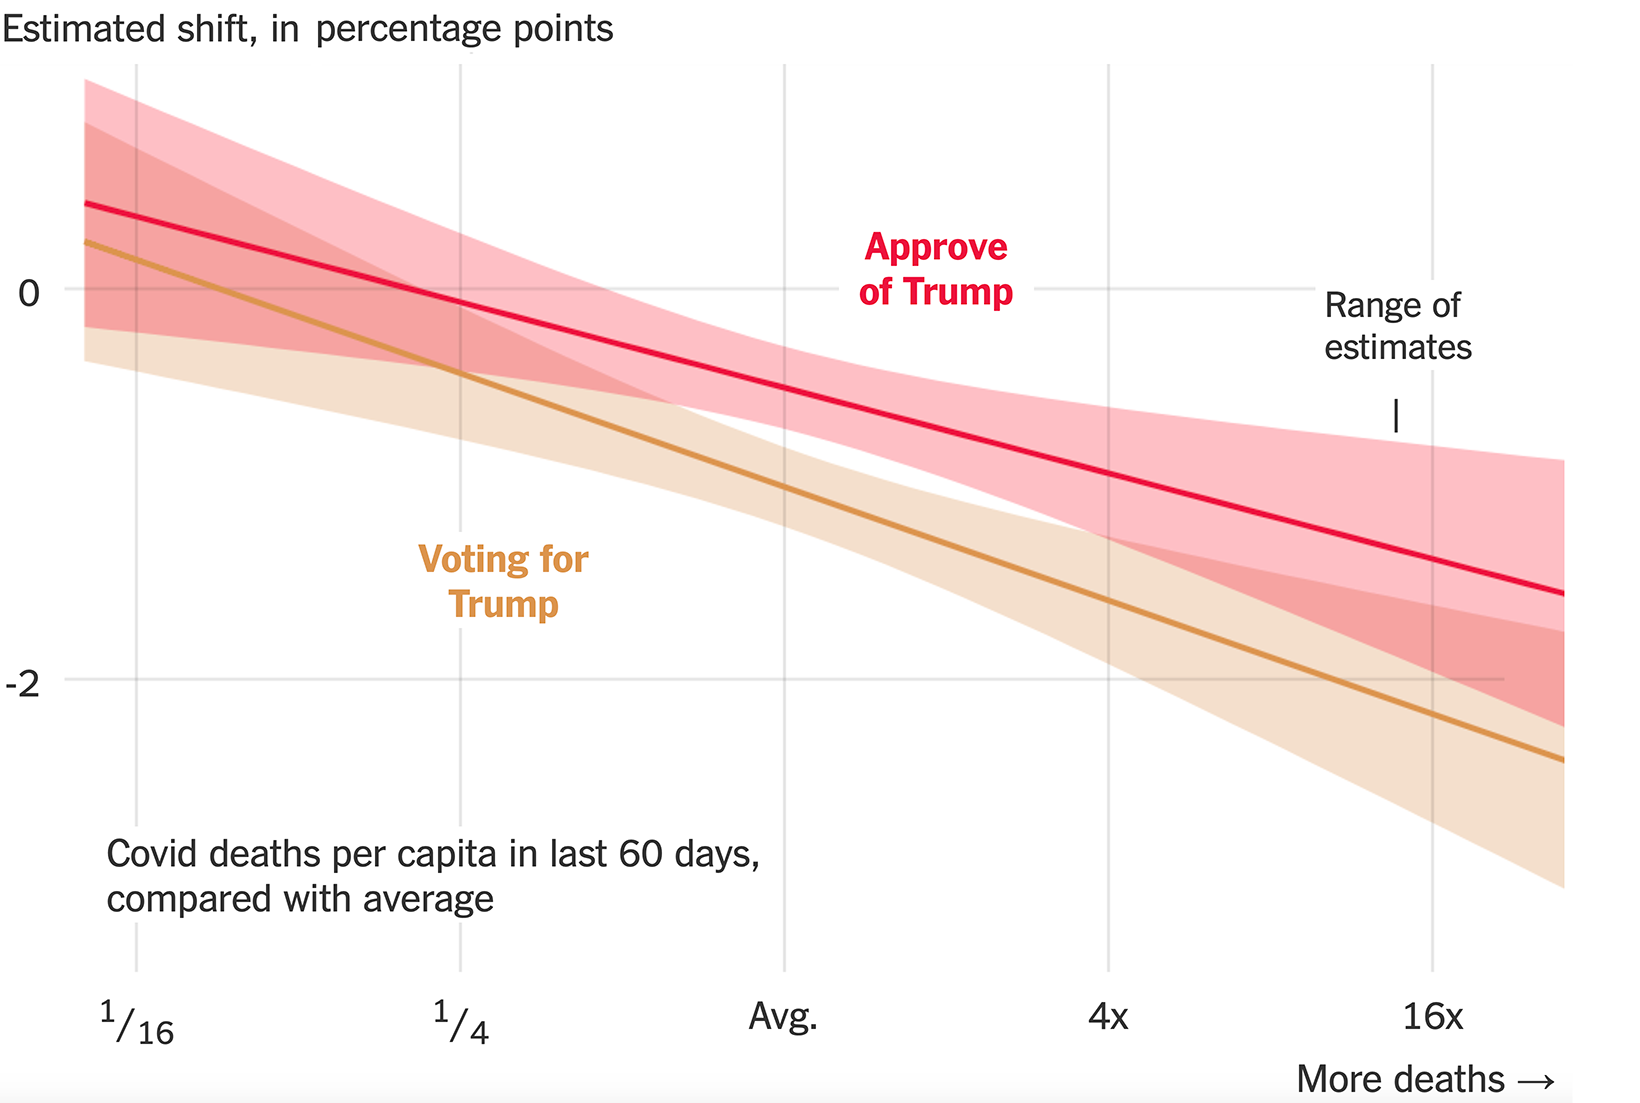
Chart #7: Voters See COVID as a Top Concern
Research has shown a correlation so far between COVID-related deaths and reduced support for the incumbent. According to this graph from the New York Times, Trump’s approval rating tends to be lower in counties with higher death rates.
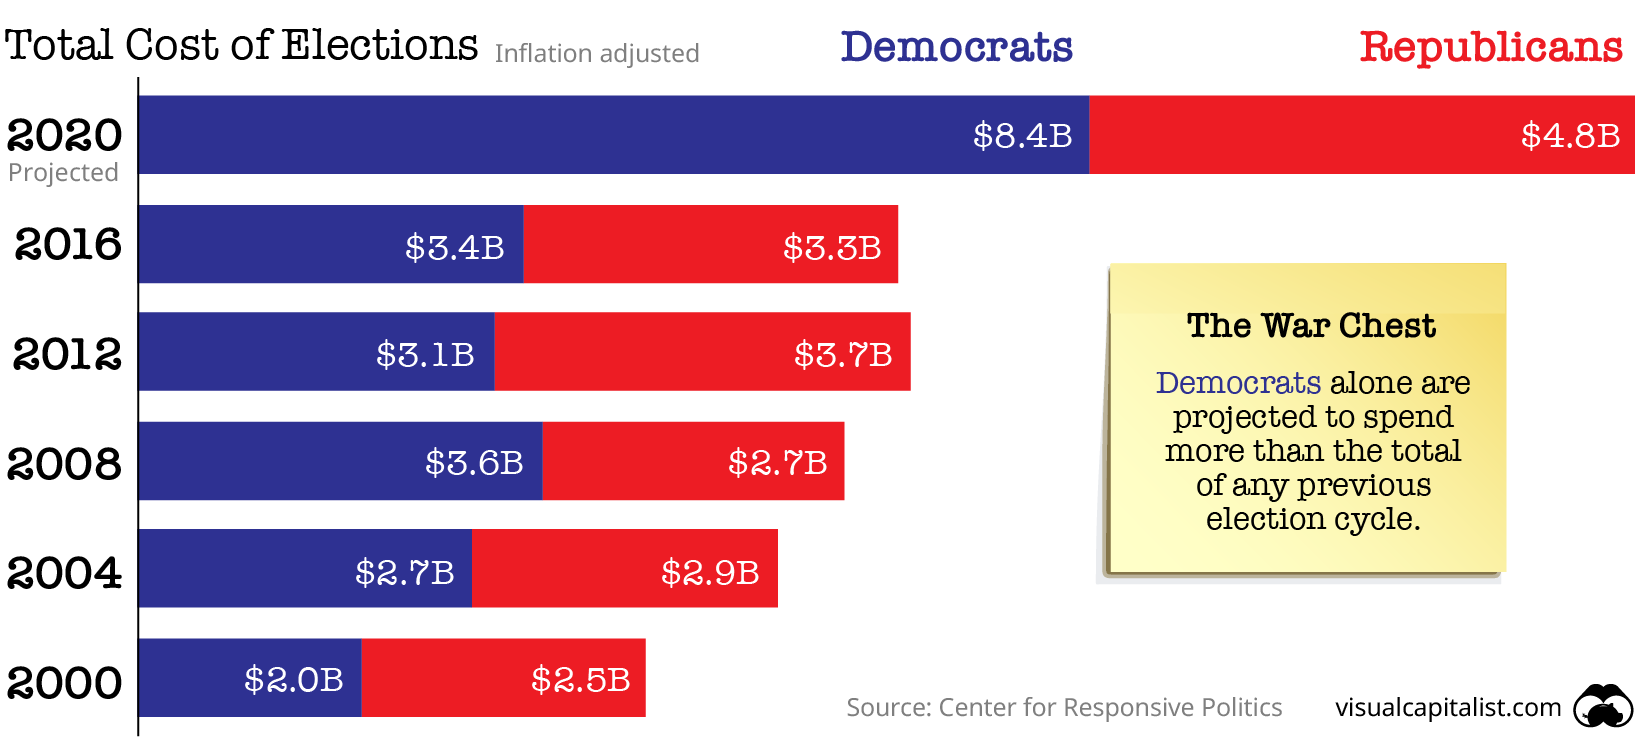
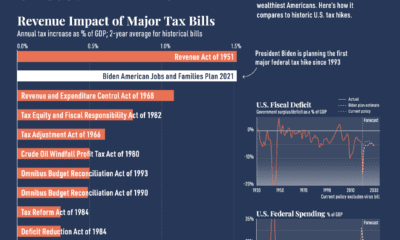
Chart #8: The price of democracy
The exceptionally high stakes could be a reason why this election is expected to be the most expensive to date. Spending is projected to reach over $13 billion, almost double the amount spent in 2016.
Source: Center for Responsive Politics
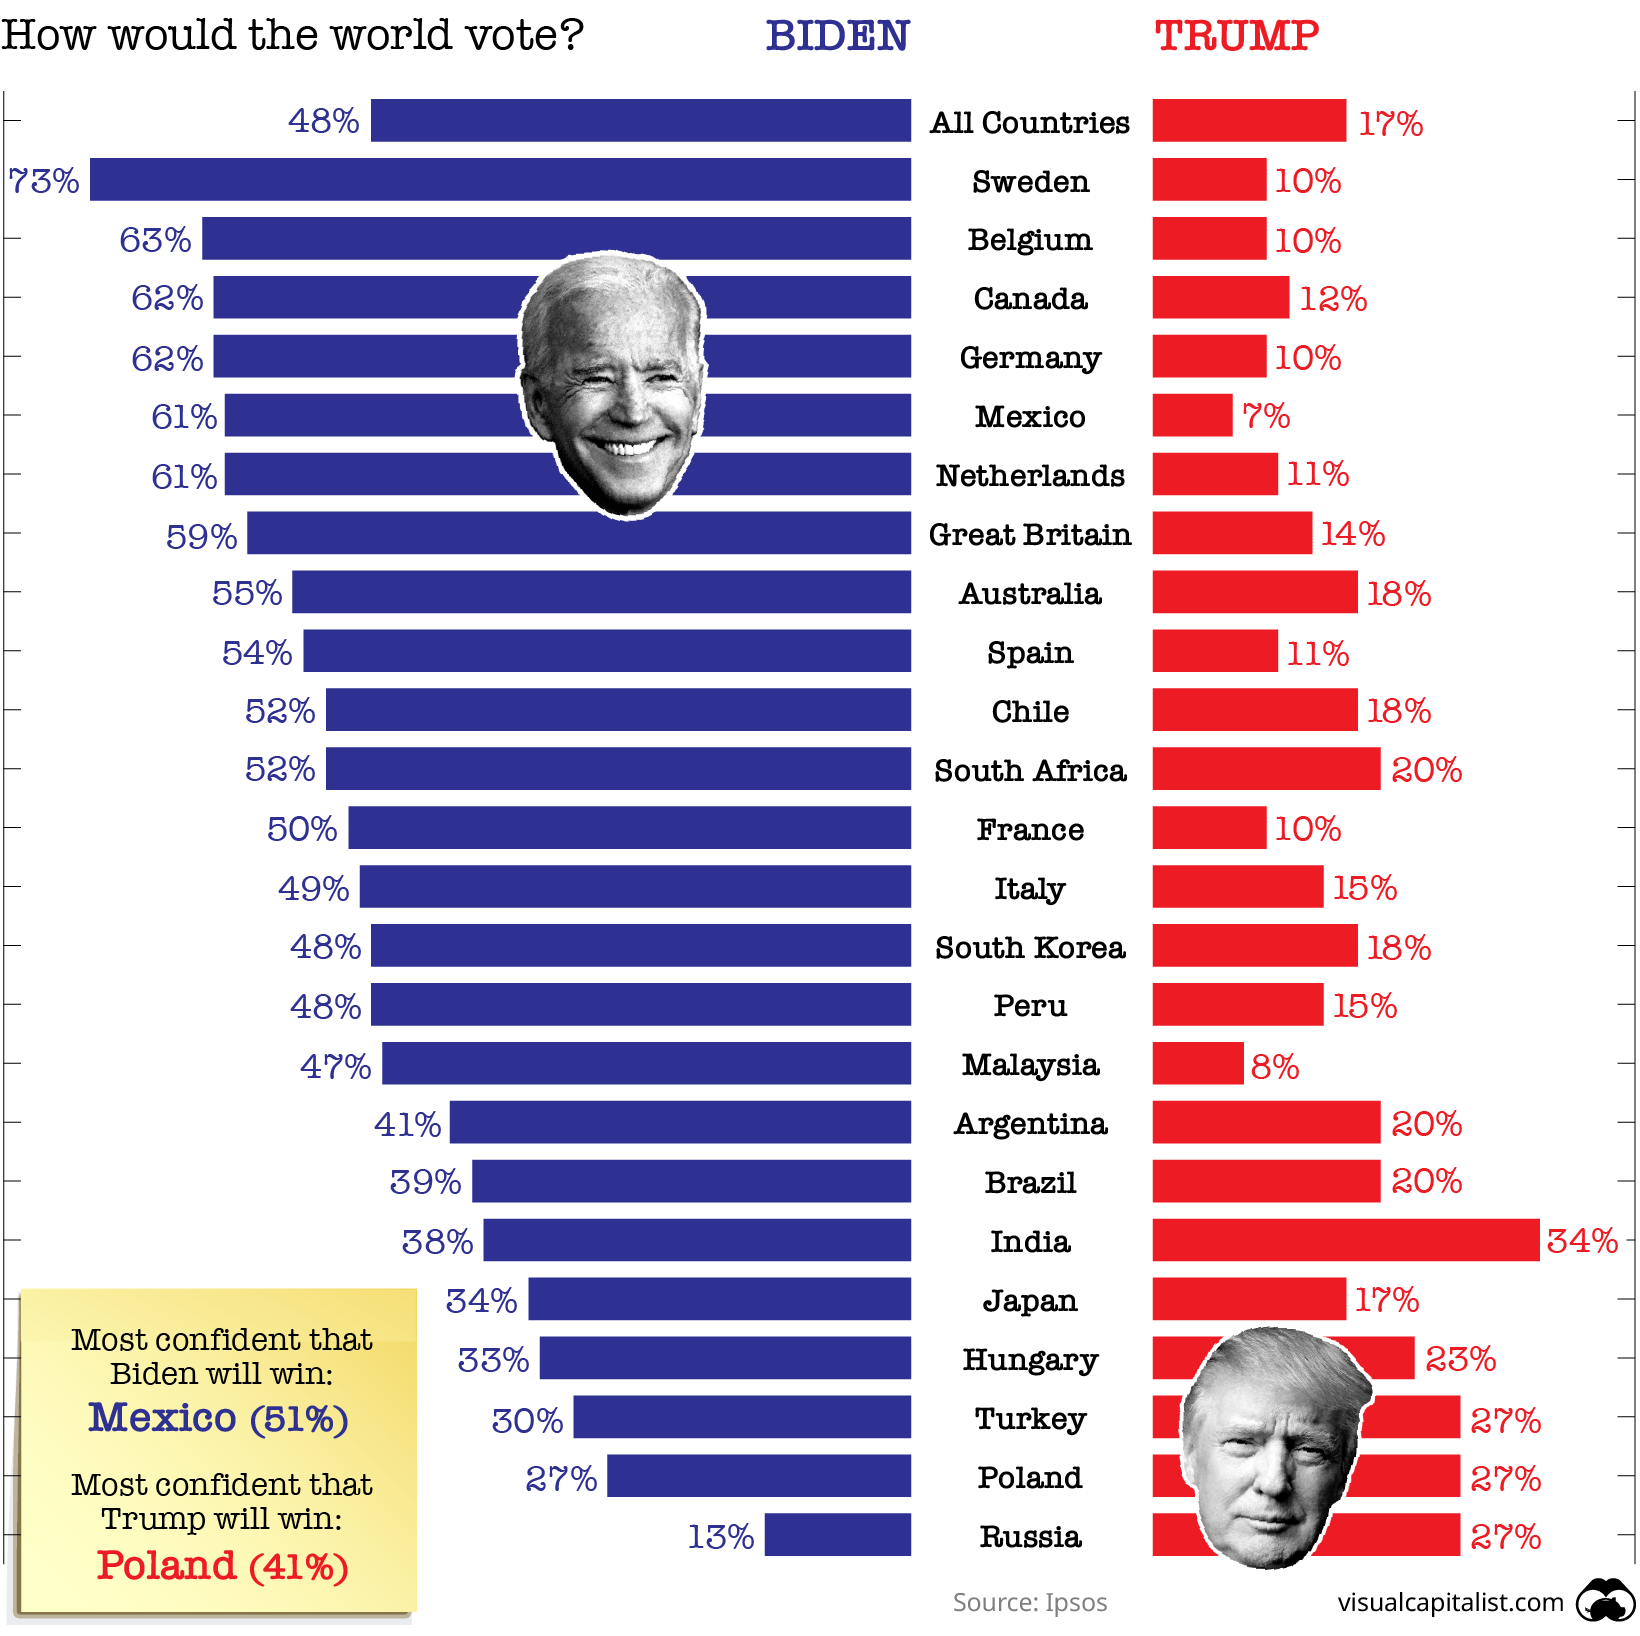
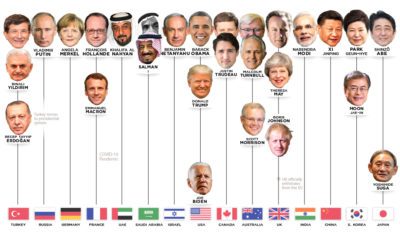
Chart #9: What the rest of the world thinks
Americans aren’t the only ones invested in the U.S. presidential election this year. The whole world is watching, and according to Ipsos, the majority is rooting for Biden.
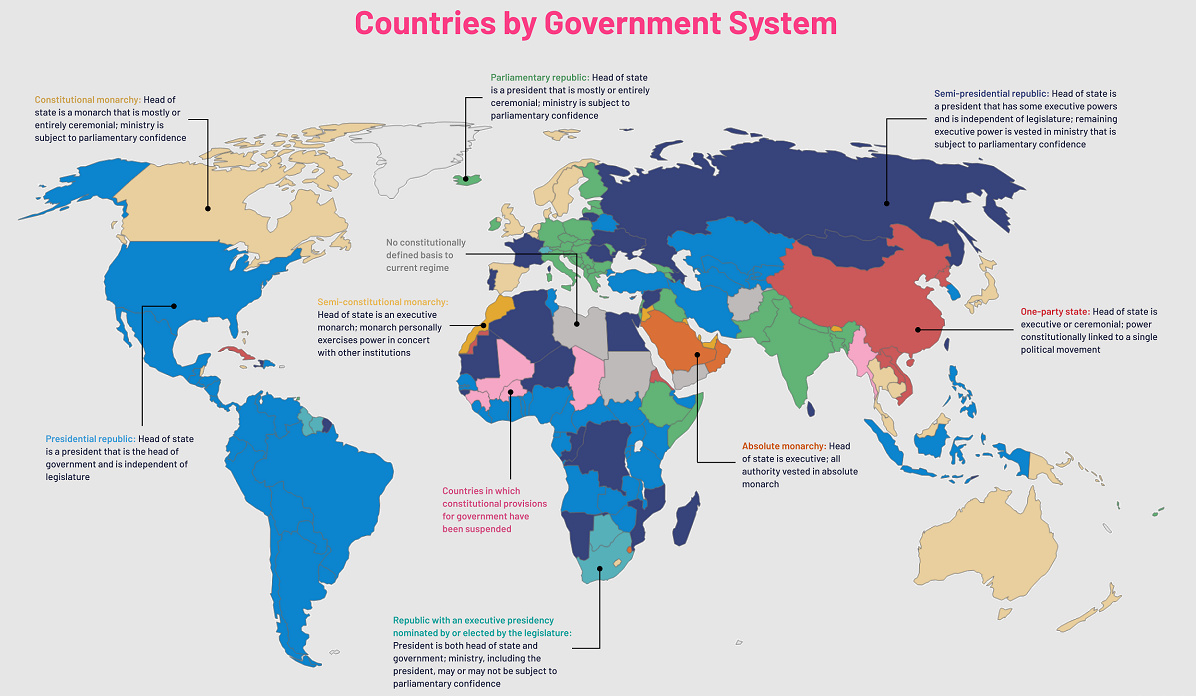
But of course, the world doesn’t get to cast a vote today, making this final chart a moot point. The real decision makers will be in the American electorate—and the forthcoming result will be on people’s minds for days, months, or maybe even years to come. on Even while political regimes across these countries have changed over time, they’ve largely followed a few different types of governance. Today, every country can ultimately be classified into just nine broad forms of government systems. This map by Truman Du uses information from Wikipedia to map the government systems that rule the world today.
Countries By Type of Government
It’s important to note that this map charts government systems according to each country’s legal framework. Many countries have constitutions stating their de jure or legally recognized system of government, but their de facto or realized form of governance may be quite different. Here is a list of the stated government system of UN member states and observers as of January 2023: Let’s take a closer look at some of these systems.
Monarchies
Brought back into the spotlight after the death of Queen Elizabeth II of England in September 2022, this form of government has a single ruler. They carry titles from king and queen to sultan or emperor, and their government systems can be further divided into three modern types: constitutional, semi-constitutional, and absolute. A constitutional monarchy sees the monarch act as head of state within the parameters of a constitution, giving them little to no real power. For example, King Charles III is the head of 15 Commonwealth nations including Canada and Australia. However, each has their own head of government. On the other hand, a semi-constitutional monarchy lets the monarch or ruling royal family retain substantial political powers, as is the case in Jordan and Morocco. However, their monarchs still rule the country according to a democratic constitution and in concert with other institutions. Finally, an absolute monarchy is most like the monarchies of old, where the ruler has full power over governance, with modern examples including Saudi Arabia and Vatican City.
Republics
Unlike monarchies, the people hold the power in a republic government system, directly electing representatives to form government. Again, there are multiple types of modern republic governments: presidential, semi-presidential, and parliamentary. The presidential republic could be considered a direct progression from monarchies. This system has a strong and independent chief executive with extensive powers when it comes to domestic affairs and foreign policy. An example of this is the United States, where the President is both the head of state and the head of government. In a semi-presidential republic, the president is the head of state and has some executive powers that are independent of the legislature. However, the prime minister (or chancellor or equivalent title) is the head of government, responsible to the legislature along with the cabinet. Russia is a classic example of this type of government. The last type of republic system is parliamentary. In this system, the president is a figurehead, while the head of government holds real power and is validated by and accountable to the parliament. This type of system can be seen in Germany, Italy, and India and is akin to constitutional monarchies. It’s also important to point out that some parliamentary republic systems operate slightly differently. For example in South Africa, the president is both the head of state and government, but is elected directly by the legislature. This leaves them (and their ministries) potentially subject to parliamentary confidence.
One-Party State
Many of the systems above involve multiple political parties vying to rule and govern their respective countries. In a one-party state, also called a single-party state or single-party system, only one political party has the right to form government. All other political parties are either outlawed or only allowed limited participation in elections. In this system, a country’s head of state and head of government can be executive or ceremonial but political power is constitutionally linked to a single political movement. China is the most well-known example of this government system, with the General Secretary of the Communist Party of China ruling as the de facto leader since 1989.
Provisional
The final form of government is a provisional government formed as an interim or transitional government. In this system, an emergency governmental body is created to manage political transitions after the collapse of a government, or when a new state is formed. Often these evolve into fully constitutionalized systems, but sometimes they hold power for longer than expected. Some examples of countries that are considered provisional include Libya, Burkina Faso, and Chad.