For a second year in a row, we have worked with Roy Sebag of Natural Resource Holdings to produce an in-depth report of all gold deposits hold be public, private, and government backed companies.
— View the full 40 page PDF report. —
Results Discussion
We were able to identify a total of 580 deposits that have over 1,000,000 ounces of gold for a total of 3.72 billion in-situ ounces. The average grade of all deposits is 1.01 g/t Au. These deposits are owned by 312 entities including public, private, and government sponsored corporations. 261 of the deposits were owned (or partially owned) by independent junior miners.
2013 vs Previous Years
It is our belief that this is by far the most comprehensive report yet. That said, those that compare this report to 2012 will notice significant differences in the final metrics. Most notably:
Total deposits over 1 million oz increased from 439 to 580 worldwide. Total ounces have increased from 3.02 billion oz to 3.72 billion oz of Au. Average grade has increased from 0.82 g/t to 1.01 g/t Au.
The chief difference is that this year we decided to include all African deposits and mines, including projects that we believe will never be mined because they did not meet our thresholds of grade or depth. However, by including these projects, which add up to about 350 million oz alone, we believe the report is much more encompassing.
Trends in Size and Grade
The project economics of gold deposits are mostly dependent on two major factors: size and grade. Without a sizeable ore body, a mining operation cannot acquire the economies of scale to bring down the cost of production. Likewise, a project without grade may not have the margins for each ton of ore processed to justify production. The average grade differed significantly between producing and undeveloped deposits. The average grade of all producing mines is 1.18 g/t Au, which is 32.6% higher than the average of all projects still in the development phase (0.89 g/t Au). This has significant implications on future gold production. In the near term, with significant volatility and the gold price at a three-year low, many of these projects are simply not economically feasible. In the medium to long term, unless major discoveries are made, either gold production must decrease (with a focus on only higher grade deposits) or the price of gold must rise to make these projects economical. A key take home point of this report each year is the rarity of large, high-grade projects. There are only 51 (8.8%) projects in the world that are more than 5 million oz and have an average grade of higher than 3 g/t Au. Of these, there are only 21 that are not yet in production.
By Geography
While North America shows the largest amount of contained gold, Africa continues to be home to some of the highest grade (and highest risk) projects on the planet. The highest grade deposits in the world are in countries such as South Africa, Tanzania, DRC, Mali, Russia, Ghana, Ivory Coast, Ecuador, Kyrgyzstan, and Papua New Guinea.
The Future of Gold Supply
Our figure for in-situ ounces that we have provided (3.72 billion oz Au) is a comprehensive view of what is below ground in terms of reserves and resources. However, to come up with a clear picture of what is actually recoverable, the reality is that there are several limitations to the amount of gold that will actually become part of the future supply chain:
Economic pit outlines have not yet been applied. Metallurgical recovery rates have not yet been applied. Inferred resources have been included in global contained ounces. Undeveloped deposits with no clear path towards permitting remain included.
To project an accurate figure, we need to take our 3.72 billion oz number and apply some math: Total in-situ ounces in database: 3,720,865,356 oz 70% of total become mines: 2,604,605,749 oz 70% metallurgical recovery rate: 1,823,224,024 oz This number, 1.82 billion oz, becomes really interesting when we look at annual extractable supply. Averaged over 50 years, the supply is equal to 1,134 tonnes (36,464,480 oz) of gold per year. This figure is equal to only 42.0% of the 2,700 tonnes (86,807,016 oz) of worldwide gold production in 2012.
Conclusion
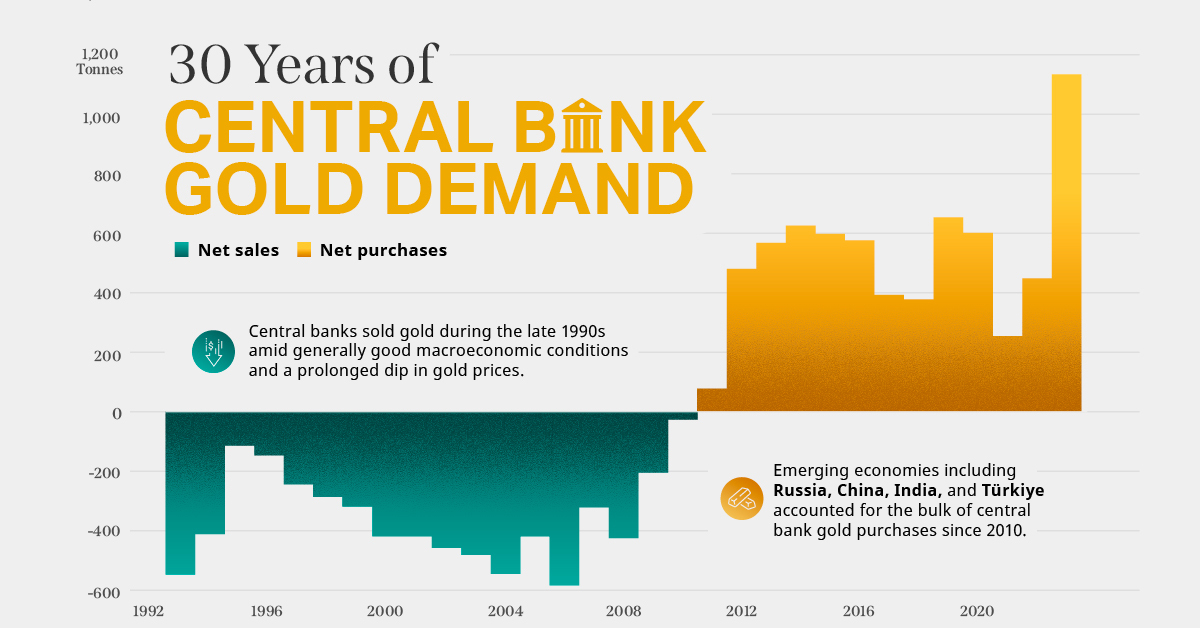
Led by countries such as Russia and China, central banks have recently become net buyers of gold. Meanwhile, ETF gold outflows have been a temporary source of supply this year, but obviously this cannot persist. It’s also unreasonable to assume that recycling will make up a significantly greater piece of supply without the price of gold increasing substantially. With the grade of current producing gold mines being 32.6% higher than undeveloped deposits, it makes the supply scenario even more clear. Not only is the current yearly mine supply difficult to sustain, but future mines coming online will be challenged by grade and margins to be economical at today’s prices. Mathematically, unless we have high-grade, high ounce deposits that are being fast tracked online, it will be very difficult to find a way to get supply to match demand. on Did you know that nearly one-fifth of all the gold ever mined is held by central banks? Besides investors and jewelry consumers, central banks are a major source of gold demand. In fact, in 2022, central banks snapped up gold at the fastest pace since 1967. However, the record gold purchases of 2022 are in stark contrast to the 1990s and early 2000s, when central banks were net sellers of gold. The above infographic uses data from the World Gold Council to show 30 years of central bank gold demand, highlighting how official attitudes toward gold have changed in the last 30 years.
Why Do Central Banks Buy Gold?
Gold plays an important role in the financial reserves of numerous nations. Here are three of the reasons why central banks hold gold:
Balancing foreign exchange reserves Central banks have long held gold as part of their reserves to manage risk from currency holdings and to promote stability during economic turmoil. Hedging against fiat currencies Gold offers a hedge against the eroding purchasing power of currencies (mainly the U.S. dollar) due to inflation. Diversifying portfolios Gold has an inverse correlation with the U.S. dollar. When the dollar falls in value, gold prices tend to rise, protecting central banks from volatility. The Switch from Selling to Buying In the 1990s and early 2000s, central banks were net sellers of gold. There were several reasons behind the selling, including good macroeconomic conditions and a downward trend in gold prices. Due to strong economic growth, gold’s safe-haven properties were less valuable, and low returns made it unattractive as an investment. Central bank attitudes toward gold started changing following the 1997 Asian financial crisis and then later, the 2007–08 financial crisis. Since 2010, central banks have been net buyers of gold on an annual basis. Here’s a look at the 10 largest official buyers of gold from the end of 1999 to end of 2021: Rank CountryAmount of Gold Bought (tonnes)% of All Buying #1🇷🇺 Russia 1,88828% #2🇨🇳 China 1,55223% #3🇹🇷 Türkiye 5418% #4🇮🇳 India 3956% #5🇰🇿 Kazakhstan 3455% #6🇺🇿 Uzbekistan 3115% #7🇸🇦 Saudi Arabia 1803% #8🇹🇭 Thailand 1682% #9🇵🇱 Poland1282% #10🇲🇽 Mexico 1152% Total5,62384% Source: IMF The top 10 official buyers of gold between end-1999 and end-2021 represent 84% of all the gold bought by central banks during this period. Russia and China—arguably the United States’ top geopolitical rivals—have been the largest gold buyers over the last two decades. Russia, in particular, accelerated its gold purchases after being hit by Western sanctions following its annexation of Crimea in 2014. Interestingly, the majority of nations on the above list are emerging economies. These countries have likely been stockpiling gold to hedge against financial and geopolitical risks affecting currencies, primarily the U.S. dollar. Meanwhile, European nations including Switzerland, France, Netherlands, and the UK were the largest sellers of gold between 1999 and 2021, under the Central Bank Gold Agreement (CBGA) framework. Which Central Banks Bought Gold in 2022? In 2022, central banks bought a record 1,136 tonnes of gold, worth around $70 billion. Country2022 Gold Purchases (tonnes)% of Total 🇹🇷 Türkiye14813% 🇨🇳 China 625% 🇪🇬 Egypt 474% 🇶🇦 Qatar333% 🇮🇶 Iraq 343% 🇮🇳 India 333% 🇦🇪 UAE 252% 🇰🇬 Kyrgyzstan 61% 🇹🇯 Tajikistan 40.4% 🇪🇨 Ecuador 30.3% 🌍 Unreported 74165% Total1,136100% Türkiye, experiencing 86% year-over-year inflation as of October 2022, was the largest buyer, adding 148 tonnes to its reserves. China continued its gold-buying spree with 62 tonnes added in the months of November and December, amid rising geopolitical tensions with the United States. Overall, emerging markets continued the trend that started in the 2000s, accounting for the bulk of gold purchases. Meanwhile, a significant two-thirds, or 741 tonnes of official gold purchases were unreported in 2022. According to analysts, unreported gold purchases are likely to have come from countries like China and Russia, who are looking to de-dollarize global trade to circumvent Western sanctions. Share via: Facebook Twitter LinkedIn More
There were several reasons behind the selling, including good macroeconomic conditions and a downward trend in gold prices. Due to strong economic growth, gold’s safe-haven properties were less valuable, and low returns made it unattractive as an investment.
Central bank attitudes toward gold started changing following the 1997 Asian financial crisis and then later, the 2007–08 financial crisis. Since 2010, central banks have been net buyers of gold on an annual basis.
Here’s a look at the 10 largest official buyers of gold from the end of 1999 to end of 2021:
Source: IMF
The top 10 official buyers of gold between end-1999 and end-2021 represent 84% of all the gold bought by central banks during this period.
Russia and China—arguably the United States’ top geopolitical rivals—have been the largest gold buyers over the last two decades. Russia, in particular, accelerated its gold purchases after being hit by Western sanctions following its annexation of Crimea in 2014.
Interestingly, the majority of nations on the above list are emerging economies. These countries have likely been stockpiling gold to hedge against financial and geopolitical risks affecting currencies, primarily the U.S. dollar.
Meanwhile, European nations including Switzerland, France, Netherlands, and the UK were the largest sellers of gold between 1999 and 2021, under the Central Bank Gold Agreement (CBGA) framework.
Which Central Banks Bought Gold in 2022?
In 2022, central banks bought a record 1,136 tonnes of gold, worth around $70 billion. Türkiye, experiencing 86% year-over-year inflation as of October 2022, was the largest buyer, adding 148 tonnes to its reserves. China continued its gold-buying spree with 62 tonnes added in the months of November and December, amid rising geopolitical tensions with the United States. Overall, emerging markets continued the trend that started in the 2000s, accounting for the bulk of gold purchases. Meanwhile, a significant two-thirds, or 741 tonnes of official gold purchases were unreported in 2022. According to analysts, unreported gold purchases are likely to have come from countries like China and Russia, who are looking to de-dollarize global trade to circumvent Western sanctions.