However, this highly-integrated Great Lakes economic engine is different than many others – that’s because it has an international border right down the middle of it. The area’s five massive freshwater lakes are actually nestled right between eight U.S. states and two Canadian provinces, making frictionless trade a necessity to stay competitive in global markets.
How This Supply Chain Works
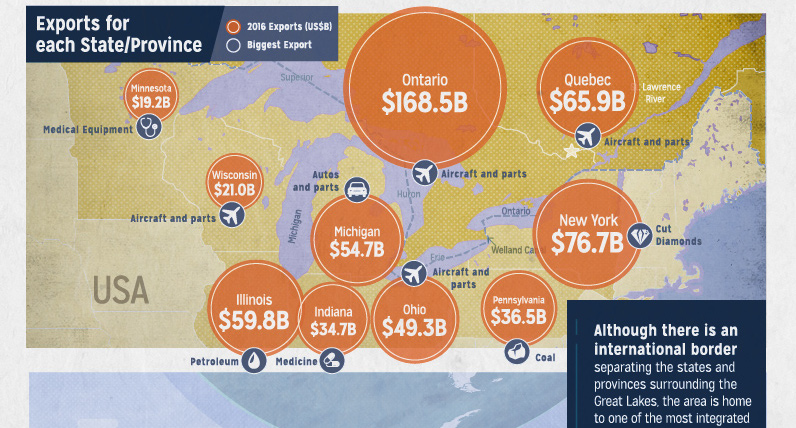
Today’s infographic comes to us from the Council of the Great Lakes Region, and it details the integration of the cross-border supply chain that helps the region make goods that are competitive in international markets.
In today’s extremely competitive and borderless global economy, many goods that get produced are ultimately the result of a group effort. Both large and small companies rely heavily on highly specialized suppliers from all parts of the globe to get what they need to build the best product. Luckily, in the Great Lakes economy, one does not have to go far to find goods or services to fill these gaps.
Goods of the Great Lakes
- Manufacturing Both the automotive and aerospace industries are incredibly important to the United States and Canada – and within the Great Lakes region, these industries are highly integrated to compete on a global level. In the auto sector, supply chains rely on parts to come from multiple companies in both the U.S. and Canada. In some cases, automobiles may contain components that have crossed the border up to 18 times before the finished product reaches the final car lot. The aerospace supply chains between the United States and Canada are also highly interdependent. In 2016, for example, Canada was the fifth largest foreign market for U.S. aerospace exports, valued at approximately $8.3 billion. Meanwhile, the United States is also Canada’s largest aerospace market, receiving 60% of all Canadian aerospace exports.
- Mining and Energy Manufacturers in the Great Lakes don’t have to look far for the raw materials needed to manufacture autos and airplanes. These can be found nearby, along with other key metals and minerals. Some key examples? Pennsylvania produces important met coal, which is used to produce steel, while Minnesota is the largest producer of iron ore in the United States. North of the border, Quebec’s aluminum is becoming more important for auto and aerospace producers in both Michigan and Ontario. As a whole, the Great Lakes region produces billions of dollars worth of minerals every year. Although the Great Lake states are not known for their crude oil production, they are home to three of the country’s 10 largest refineries. Processing oil from the U.S., Canada, and other international sources, these refineries make sure fuel is abundantly close for Great Lakes industry.
- Food and Agriculture While goods vary greatly from place to place, the food industry is also very interconnected in the Great Lakes. For example, Pennsylvania benefits from selling chocolate products to Canada, while Minnesota and Ohio both sell animal feed. Every year, Great Lake states ship $8.4 billion of exports to Canada, receiving $8.9 billion of imports in return.
on The good news is that the Federal Reserve, U.S. Treasury, and Federal Deposit Insurance Corporation are taking action to restore confidence and take the appropriate measures to help provide stability in the market. With this in mind, the above infographic from New York Life Investments looks at the factors that impact bonds, how different types of bonds have historically performed across market environments, and the current bond market volatility in a broader context.
Bond Market Returns
Bonds had a historic year in 2022, posting one of the worst returns ever recorded. As interest rates rose at the fastest pace in 40 years, it pushed bond prices lower due to their inverse relationship. In a rare year, bonds dropped 13%.
Source: FactSet, 01/02/2023.
Bond prices are only one part of a bond’s total return—the other looks at the income a bond provides. As interest rates have increased in the last year, it has driven higher bond yields in 2023.
Source: YCharts, 3/20/2023.
With this recent performance in mind, let’s look at some other key factors that impact the bond market.
Factors Impacting Bond Markets
Interest rates play a central role in bond market dynamics. This is because they affect a bond’s price. When rates are rising, existing bonds with lower rates are less valuable and prices decline. When rates are dropping, existing bonds with higher rates are more valuable and their prices rise. In March, the Federal Reserve raised rates 25 basis points to fall within the 4.75%-5.00% range, a level not seen since September 2007. Here are projections for where the federal funds rate is headed in 2023:
Federal Reserve Projection*: 5.1% Economist Projections**: 5.3%
*Based on median estimates in the March summary of quarterly economic projections.**Projections based on March 10-15 Bloomberg economist survey. Together, interest rates and the macroenvironment can have a positive or negative effect on bonds.
Positive
Here are three variables that may affect bond prices in a positive direction:
Lower Inflation: Reduces likelihood of interest rate hikes. Lower Interest Rates: When rates are falling, bond prices are typically higher. Recession: Can prompt a cut in interest rates, boosting bond prices.
Negative
On the other hand, here are variables that may negatively impact bond prices:
Higher Inflation: Can increase the likelihood of the Federal Reserve to raise interest rates. Rising Interest Rates: Interest rate hikes lead bond prices to fall. Weaker Fundamentals: When a bond’s credit risk gets worse, its price can drop. Credit risk indicates the chance of a default, the risk of a bond issuer not making interest payments within a given time period.
Bonds have been impacted by these negative factors since inflation started rising in March 2021.
Fixed Income Opportunities
Below, we show the types of bonds that have had the best performance during rising rates and recessions.
Source: Derek Horstmeyer, George Mason University 12/3/2022. As we can see, U.S. ultrashort bonds performed the best during rising rates. Mortgage bonds outperformed during recessions, averaging 11.4% returns, but with higher volatility. U.S. long-term bonds had 7.7% average returns, the best across all market conditions. In fact, they were also a close second during recessions. When rates are rising, ultrashort bonds allow investors to capture higher rates when they mature, often with lower historical volatility.
A Closer Look at Bond Market Volatility
While bond market volatility has jumped this year, current dislocations may provide investment opportunities. Bond dislocations allow investors to buy at lower prices, factoring in that the fundamental quality of the bond remains strong. With this in mind, here are two areas of the bond market that may provide opportunities for investors:
Investment-Grade Corporate Bonds: Higher credit quality makes them potentially less vulnerable to increasing interest rates. Intermediate Bonds (2-10 Years): Allow investors to lock in higher rates.
Both types of bonds focus on quality and capturing higher yields when faced with challenging market conditions.
Finding the Upside
Much of the volatility seen in the banking sector was due to banks buying bonds during the pandemic—or even earlier—at a time when interest rates were historically low. Since then, rates have climbed considerably. Should rates moderate or stop increasing, this may present better market conditions for bonds. In this way, today’s steep discount in bond markets may present an attractive opportunity for price appreciation. At the same time, investors can potentially lock in strong yields as inflation may subside in the coming years ahead. Learn more about bond investing strategies with New York Life Investments.