From stocks to bonds to alternatives, investors can choose from a wide variety of investment types. The choices can be overwhelming—leaving people to wonder if there’s one investment that consistently outperforms, or if there’s a predictable pattern of performance. This graphic, which is inspired by and uses data from The Measure of a Plan, shows historical returns by asset class for the last 36 years.
Asset Class Returns by Year
This analysis includes assets of various types, geographies, and risk levels. It uses real total returns, meaning that they account for inflation and the reinvestment of dividends. Here’s how the data breaks down, this time organized by asset class rather than year: *Data for 2020 is as of October 31 The top-performing asset class so far in 2020 is gold, with a return more than four times that of second-place U.S. bonds. On the other hand, real estate investment trusts (REITs) have been the worst-performing investments. Needless to say, economic shutdowns due to COVID-19 have had a devastating effect on commercial real estate. Over time, the order is fairly random with asset classes moving up and down the ranks. For example, emerging market stocks plummeted to last place amid the global financial crisis in 2008, only to rise to the top the following year. International bonds were near the bottom of the barrel in 2017, but rose to the top during the 2018 market selloff. There are also large swings in the returns investors can expect in any given year. While the best-performing asset class returned just 1% in 2018, it returned a whopping 71.5% in 2009.
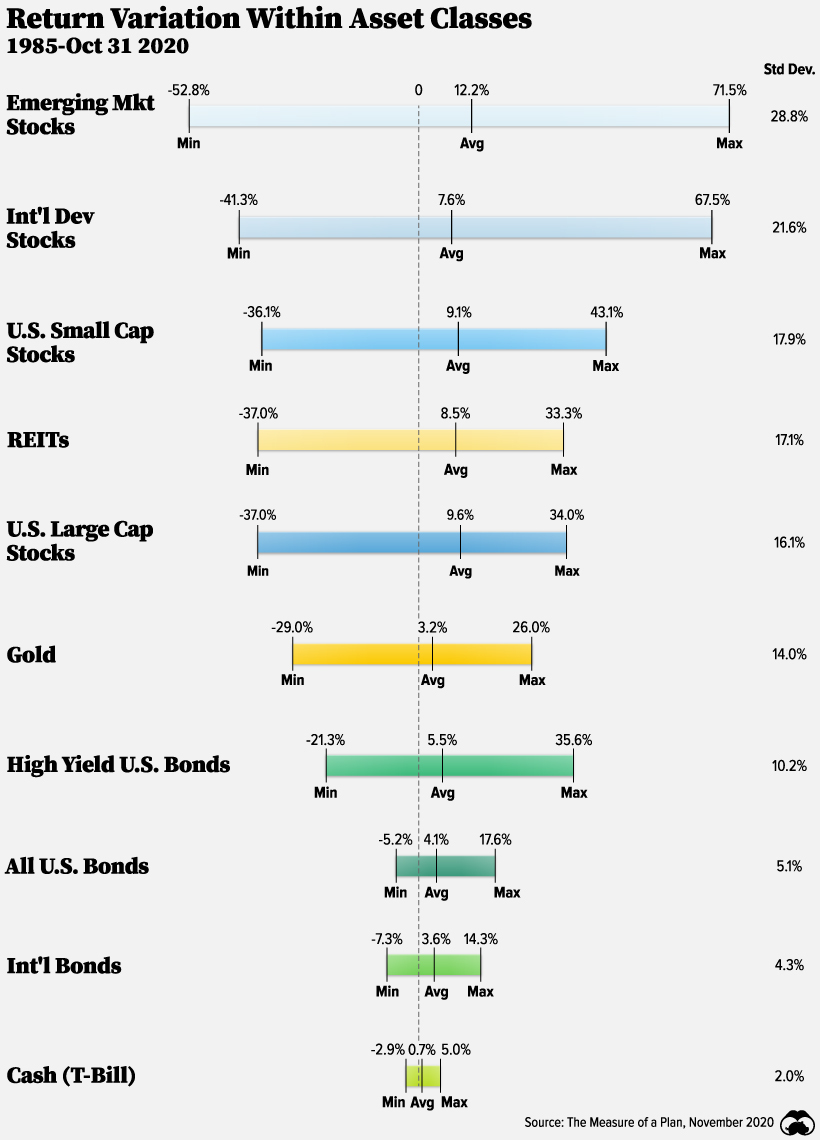
Variation Within Asset Classes
Within individual asset classes, the range in returns can also be quite large. Here’s the minimum, maximum, and average returns for each asset class. We’ve also shown each investment’s standard deviation, which is a measure of volatility or risk.
Although emerging market stocks have seen the highest average return, they have also seen the highest standard deviation. On the flip side, T-bills have seen returns lower than inflation since 2009, but have come with the lowest risk. Investors should factor in risk when they are looking at the return potential of an asset class.
Variety is the Spice of Portfolios
Upon reviewing the historical returns by asset class, there’s no particular investment that has consistently outperformed. Rankings have changed over time depending on a number of economic variables. However, having a variety of asset classes can ensure you are best positioned to take advantage of tailwinds in any particular year. For instance, bonds have a low correlation with stocks and can cushion against losses during market downturns. If your mirror could talk, it would tell you there’s no one asset class to rule them all—but a mix of asset classes may be your best chance at success. on Last year, stock and bond returns tumbled after the Federal Reserve hiked interest rates at the fastest speed in 40 years. It was the first time in decades that both asset classes posted negative annual investment returns in tandem. Over four decades, this has happened 2.4% of the time across any 12-month rolling period. To look at how various stock and bond asset allocations have performed over history—and their broader correlations—the above graphic charts their best, worst, and average returns, using data from Vanguard.
How Has Asset Allocation Impacted Returns?
Based on data between 1926 and 2019, the table below looks at the spectrum of market returns of different asset allocations:
We can see that a portfolio made entirely of stocks returned 10.3% on average, the highest across all asset allocations. Of course, this came with wider return variance, hitting an annual low of -43% and a high of 54%.
A traditional 60/40 portfolio—which has lost its luster in recent years as low interest rates have led to lower bond returns—saw an average historical return of 8.8%. As interest rates have climbed in recent years, this may widen its appeal once again as bond returns may rise.
Meanwhile, a 100% bond portfolio averaged 5.3% in annual returns over the period. Bonds typically serve as a hedge against portfolio losses thanks to their typically negative historical correlation to stocks.
A Closer Look at Historical Correlations
To understand how 2022 was an outlier in terms of asset correlations we can look at the graphic below:
The last time stocks and bonds moved together in a negative direction was in 1969. At the time, inflation was accelerating and the Fed was hiking interest rates to cool rising costs. In fact, historically, when inflation surges, stocks and bonds have often moved in similar directions. Underscoring this divergence is real interest rate volatility. When real interest rates are a driving force in the market, as we have seen in the last year, it hurts both stock and bond returns. This is because higher interest rates can reduce the future cash flows of these investments. Adding another layer is the level of risk appetite among investors. When the economic outlook is uncertain and interest rate volatility is high, investors are more likely to take risk off their portfolios and demand higher returns for taking on higher risk. This can push down equity and bond prices. On the other hand, if the economic outlook is positive, investors may be willing to take on more risk, in turn potentially boosting equity prices.
Current Investment Returns in Context
Today, financial markets are seeing sharp swings as the ripple effects of higher interest rates are sinking in. For investors, historical data provides insight on long-term asset allocation trends. Over the last century, cycles of high interest rates have come and gone. Both equity and bond investment returns have been resilient for investors who stay the course.