Whether you are extremely frugal, or you’re known to indulge in the finer things in life, how you allocate your spending is partially a function of how much cash you have coming in the door. Simply put, the more income a household generates, the higher the portion that can be spent on items other than the usual necessities (housing, food, clothing, etc), and the more that can be saved or invested for the future.
Earning and Spending, by Income Group
Today’s visuals come to us from Engaging Data, and they use Sankey diagrams to display data from the Bureau of Labor Statistics (BLS) that helps to paint a picture of how different household income groups make and spend their money. We’ll show you three charts below for the following income groups: Let’s start by taking a look at the flows of the average American household:
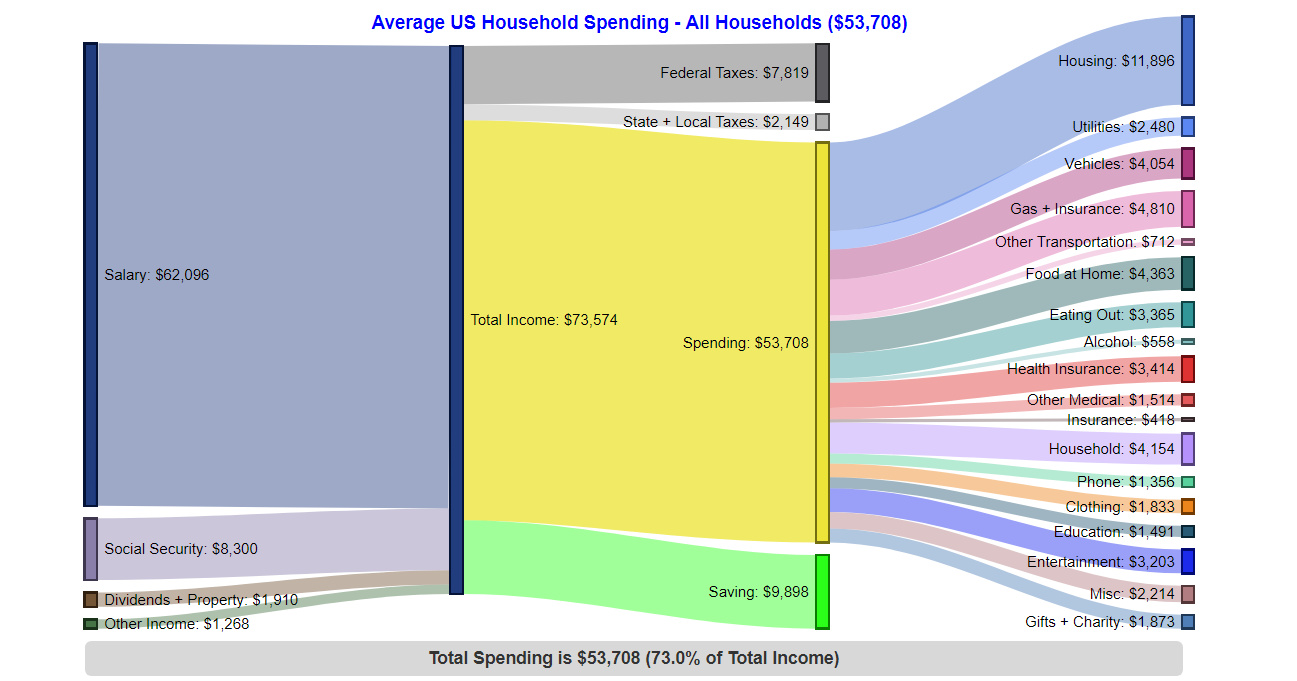
The Average American Household – $53,708 in spending (73% of total income)
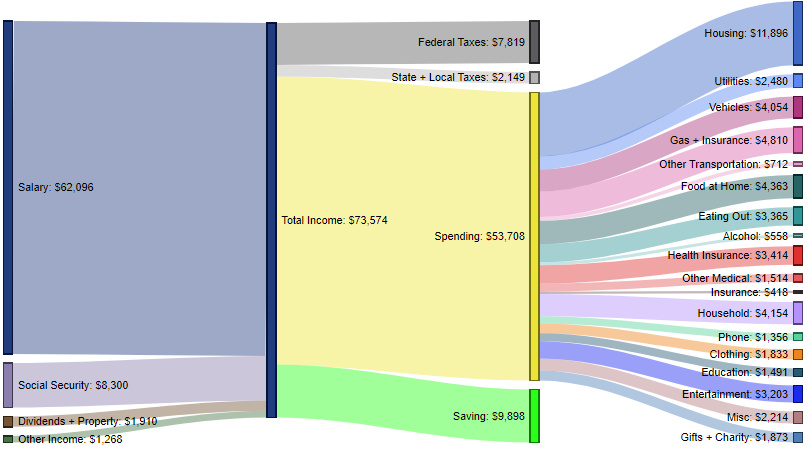
The average U.S. household has 2.5 people (1.3 income earners, 0.6 children, and 0.4 seniors) As you can see above the average household generates $73,574 of total inflows, with 84.4% of that coming from salary, and smaller portions coming from social security (11.3%), dividends and property (2.6%), and other income (1.7%). In terms of money going out, the highest allocation goes to housing (22.1% of spending), while gas and insurance (9.0%), household (7.7%), and vehicles (7.5%) make up the next largest categories. Interestingly, the average U.S. household also says it is saving just short of $10,000 per year.
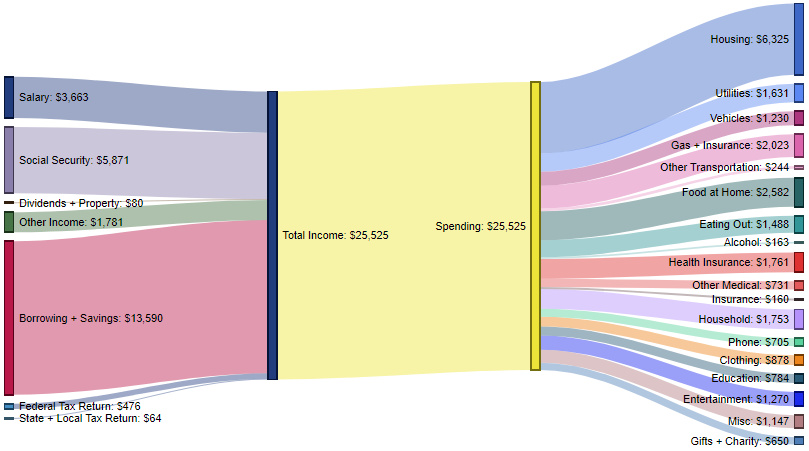
The Bottom 20% – $25,525 in spending (100% of total income)
These contain an average of 1.6 people (0.5 income earners, 0.3 children, and 0.4 seniors) How do the inflows and outflows of the average American household compare to the lowest income quintile? Here, the top-level statistic tells much of the story, as the poorest income group in America must spend 100% of money coming in to make ends meet. Further, cash comes in from many different sources, showing that there are fewer dependable sources of income for families to rely on. For expenditures, this group spends the most on housing (24.8% of spending), while other top costs of living include food at home (10.1%), gas and insurance (7.9%), health insurance (6.9%), and household costs (6.9%).
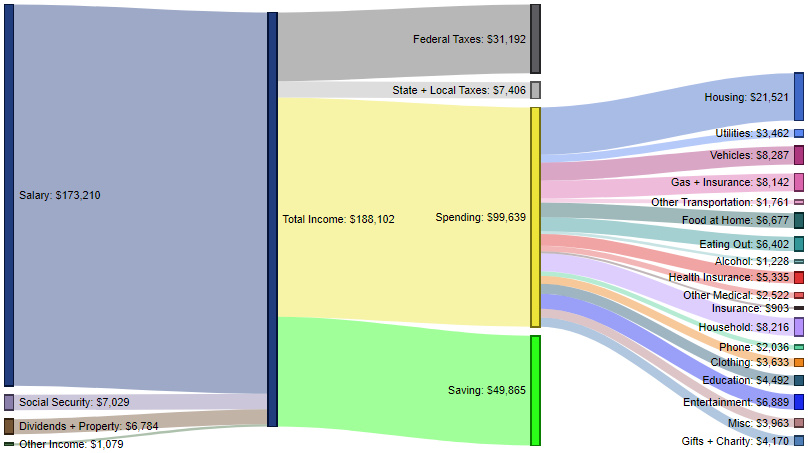
The Highest 20% – $99,639 in spending (53% of total income)
These contain an average of 3.1 people (2.1 income earners, 0.8 children, and 0.2 seniors) The wealthiest household segment brings in $188,102 in total income on average, with salaries (92.1%) being the top source of inflows. This group spends just over half of its income, with top expenses being housing (21.6%), vehicles (8.3%), household costs (8.2%), gas and insurance (8.2%), and entertainment (6.9%). The highest quintile pays just short of $40,000 in federal, state, and local taxes per year, and is also able to contribute roughly $50,000 to savings each year.
Spending Over Time
For a fascinating look at how household spending has changed over time, don’t forget to check out our previous post that charts 75 years of data on how Americans spend money. on These are in the form of Treasury securities, some of the most liquid assets worldwide. Central banks use them for foreign exchange reserves and private investors flock to them during flights to safety thanks to their perceived low default risk. Beyond these reasons, foreign investors may buy Treasuries as a store of value. They are often used as collateral during certain international trade transactions, or countries can use them to help manage exchange rate policy. For example, countries may buy Treasuries to protect their currency’s exchange rate from speculation. In the above graphic, we show the foreign holders of the U.S. national debt using data from the U.S. Department of the Treasury.
Top Foreign Holders of U.S. Debt
With $1.1 trillion in Treasury holdings, Japan is the largest foreign holder of U.S. debt. Japan surpassed China as the top holder in 2019 as China shed over $250 billion, or 30% of its holdings in four years. This bond offloading by China is the one way the country can manage the yuan’s exchange rate. This is because if it sells dollars, it can buy the yuan when the currency falls. At the same time, China doesn’t solely use the dollar to manage its currency—it now uses a basket of currencies. Here are the countries that hold the most U.S. debt: As the above table shows, the United Kingdom is the third highest holder, at over $655 billion in Treasuries. Across Europe, 13 countries are notable holders of these securities, the highest in any region, followed by Asia-Pacific at 11 different holders. A handful of small nations own a surprising amount of U.S. debt. With a population of 70,000, the Cayman Islands own a towering amount of Treasury bonds to the tune of $284 billion. There are more hedge funds domiciled in the Cayman Islands per capita than any other nation worldwide. In fact, the four smallest nations in the visualization above—Cayman Islands, Bermuda, Bahamas, and Luxembourg—have a combined population of just 1.2 million people, but own a staggering $741 billion in Treasuries.
Interest Rates and Treasury Market Dynamics
Over 2022, foreign demand for Treasuries sank 6% as higher interest rates and a strong U.S. dollar made owning these bonds less profitable. This is because rising interest rates on U.S. debt makes the present value of their future income payments lower. Meanwhile, their prices also fall. As the chart below shows, this drop in demand is a sharp reversal from 2018-2020, when demand jumped as interest rates hovered at historic lows. A similar trend took place in the decade after the 2008-09 financial crisis when U.S. debt holdings effectively tripled from $2 to $6 trillion.
Driving this trend was China’s rapid purchase of Treasuries, which ballooned from $100 billion in 2002 to a peak of $1.3 trillion in 2013. As the country’s exports and output expanded, it sold yuan and bought dollars to help alleviate exchange rate pressure on its currency. Fast-forward to today, and global interest-rate uncertainty—which in turn can impact national currency valuations and therefore demand for Treasuries—continues to be a factor impacting the future direction of foreign U.S. debt holdings.