There is growing uncertainty and volatility almost everywhere, and individual events are starting to become catalysts for sell-offs or rallies. Whether it’s Apple’s recent profit warning or Fed chair Jerome Powell saying that he is “listening closely” to the markets, investors are taking cues from current events to figure out where the herd is grazing. It’s hard to say where markets will head in 2019 – but before we get into the nitty-gritty of a new year, it’s worth taking one final look back at 2018 to see how it impacted investors.
How Markets Did in 2018
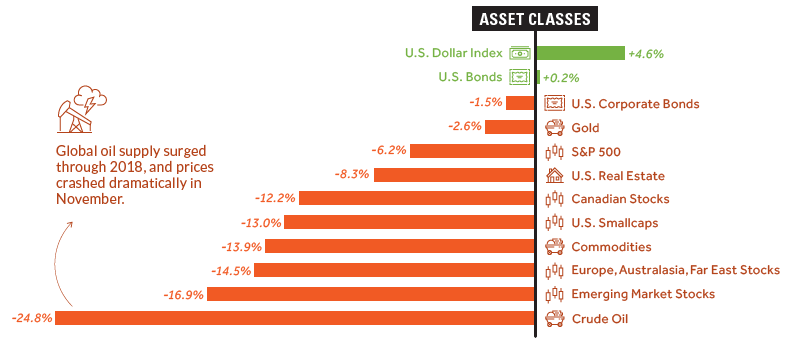
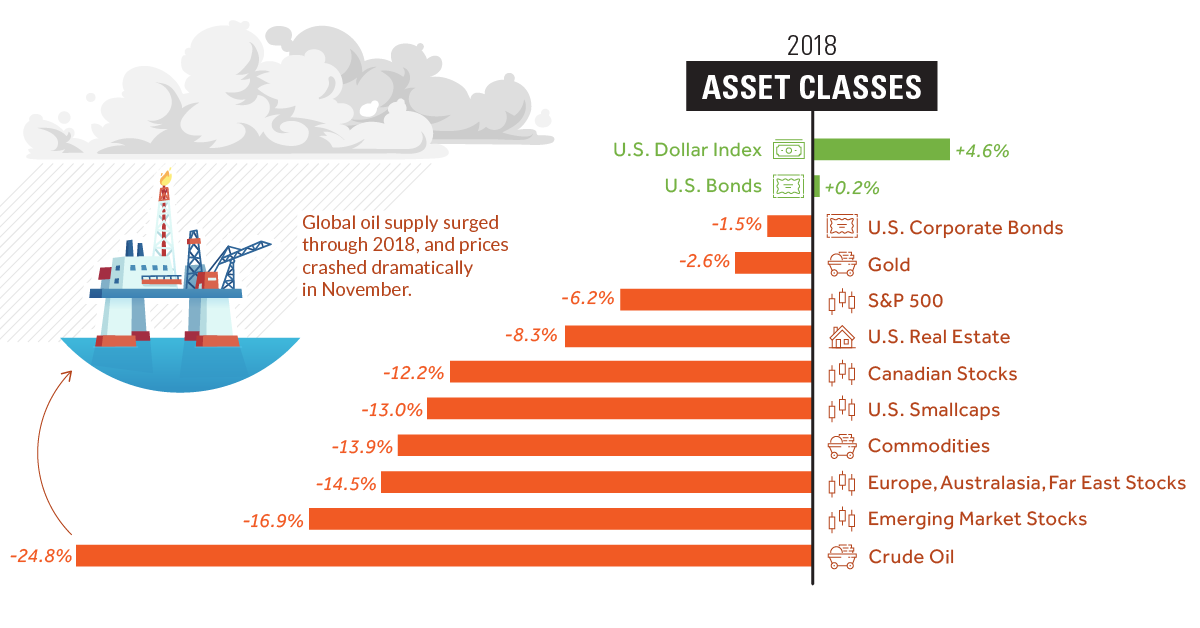
We’ll start with broad asset classes, including stocks, bonds, commodities, and cash: Note: Figures for equity markets are not including dividends As you can see, it’s mostly a sea of red. Cash turned out to be best option for the year, and several asset classes were crushed over the course of 2018, including crude oil and nearly all stocks. Despite this, large cap U.S. stocks (S&P 500) had no issues in outperforming equity alternatives, like smallcap stocks, foreign stocks, or emerging markets.
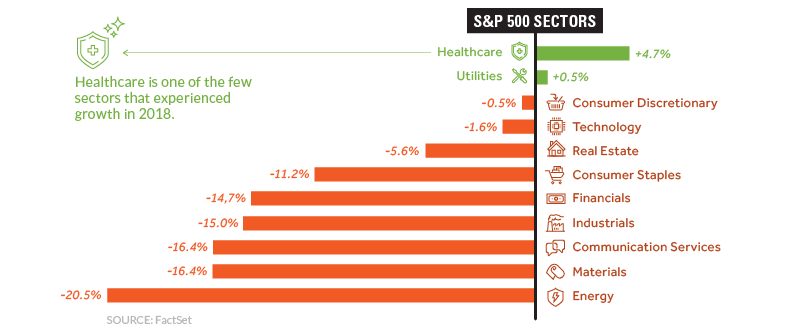
Breaking down the S&P 500 further into its sectors, it’s clear that nearly every industry struggled simultaneously. Energy (-20.5%) and Materials (-16.4%) sectors were the hardest hit, and even the Technology sector eventually capitulated by the end of the year. Amazingly, Apple was considered a $1 trillion company in August, but today the tech giant’s market capitalization has already dropped down to a measly $700 billion. The one exception to the general trend in S&P 500 stocks was Healthcare, which posted 4.7% returns over the course of 2018. Companies like Merck, Eli Lilly, and Pfizer all saw their stocks grow by double-digits, and it’s possible the sector could stay strong in 2019 as the world continues to age.
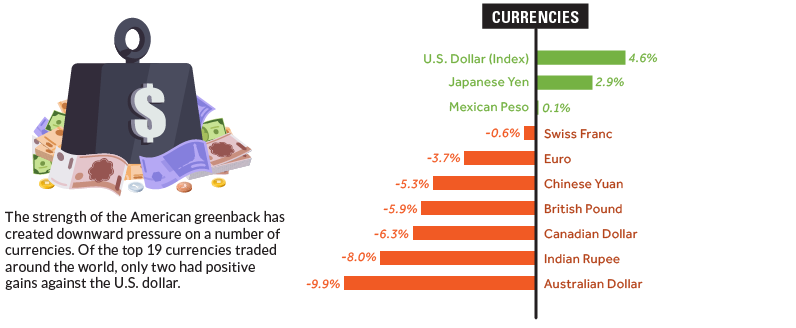
Lastly, here’s how major currency markets fared. The U.S. dollar was the strongest major currency, and the Japanese yen had an impressive year as well. The Aussie dollar was routed, and now sits at 10-year lows.
Winners and Losers
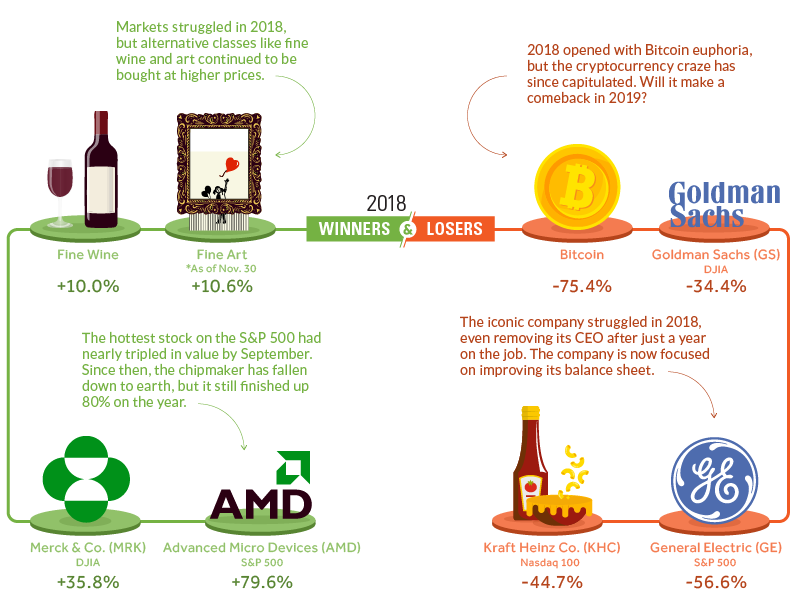
Lastly, here’s an ad hoc list of some of the biggest winners and losers in 2018 – it includes some of the stocks and assets that saw notable gains or declines over the course of the year:
Interestingly, it was the finer things in life that outperformed most major asset classes. Both fine wine and fine art gained close to 10%, leaving most other indices behind in the dust. AMD had a roller coaster year, finishing up nearly 80% as the biggest winner on the S&P 500. That said, owners of AMD stock may see things differently: the stock had actually tripled by September, and has fallen precipitously ever since. Given the above recap, what are you investing in for 2019? on These are in the form of Treasury securities, some of the most liquid assets worldwide. Central banks use them for foreign exchange reserves and private investors flock to them during flights to safety thanks to their perceived low default risk. Beyond these reasons, foreign investors may buy Treasuries as a store of value. They are often used as collateral during certain international trade transactions, or countries can use them to help manage exchange rate policy. For example, countries may buy Treasuries to protect their currency’s exchange rate from speculation. In the above graphic, we show the foreign holders of the U.S. national debt using data from the U.S. Department of the Treasury.
Top Foreign Holders of U.S. Debt
With $1.1 trillion in Treasury holdings, Japan is the largest foreign holder of U.S. debt. Japan surpassed China as the top holder in 2019 as China shed over $250 billion, or 30% of its holdings in four years. This bond offloading by China is the one way the country can manage the yuan’s exchange rate. This is because if it sells dollars, it can buy the yuan when the currency falls. At the same time, China doesn’t solely use the dollar to manage its currency—it now uses a basket of currencies. Here are the countries that hold the most U.S. debt: As the above table shows, the United Kingdom is the third highest holder, at over $655 billion in Treasuries. Across Europe, 13 countries are notable holders of these securities, the highest in any region, followed by Asia-Pacific at 11 different holders. A handful of small nations own a surprising amount of U.S. debt. With a population of 70,000, the Cayman Islands own a towering amount of Treasury bonds to the tune of $284 billion. There are more hedge funds domiciled in the Cayman Islands per capita than any other nation worldwide. In fact, the four smallest nations in the visualization above—Cayman Islands, Bermuda, Bahamas, and Luxembourg—have a combined population of just 1.2 million people, but own a staggering $741 billion in Treasuries.
Interest Rates and Treasury Market Dynamics
Over 2022, foreign demand for Treasuries sank 6% as higher interest rates and a strong U.S. dollar made owning these bonds less profitable. This is because rising interest rates on U.S. debt makes the present value of their future income payments lower. Meanwhile, their prices also fall. As the chart below shows, this drop in demand is a sharp reversal from 2018-2020, when demand jumped as interest rates hovered at historic lows. A similar trend took place in the decade after the 2008-09 financial crisis when U.S. debt holdings effectively tripled from $2 to $6 trillion.
Driving this trend was China’s rapid purchase of Treasuries, which ballooned from $100 billion in 2002 to a peak of $1.3 trillion in 2013. As the country’s exports and output expanded, it sold yuan and bought dollars to help alleviate exchange rate pressure on its currency. Fast-forward to today, and global interest-rate uncertainty—which in turn can impact national currency valuations and therefore demand for Treasuries—continues to be a factor impacting the future direction of foreign U.S. debt holdings.