Despite an early backdrop of heightened volatility, escalating trade tensions, Brexit uncertainty, and calls for a recession, the year progressed in an unexpectedly pleasant fashion. The Fed used its limited arsenal to provide additional stimulus, and global markets soaked it up to extend the decade-long bull run. By the end of 2019, every major asset class was in the black — and the S&P 500 surged to finish with its best annual return since 2013.
Markets Roundup for 2019
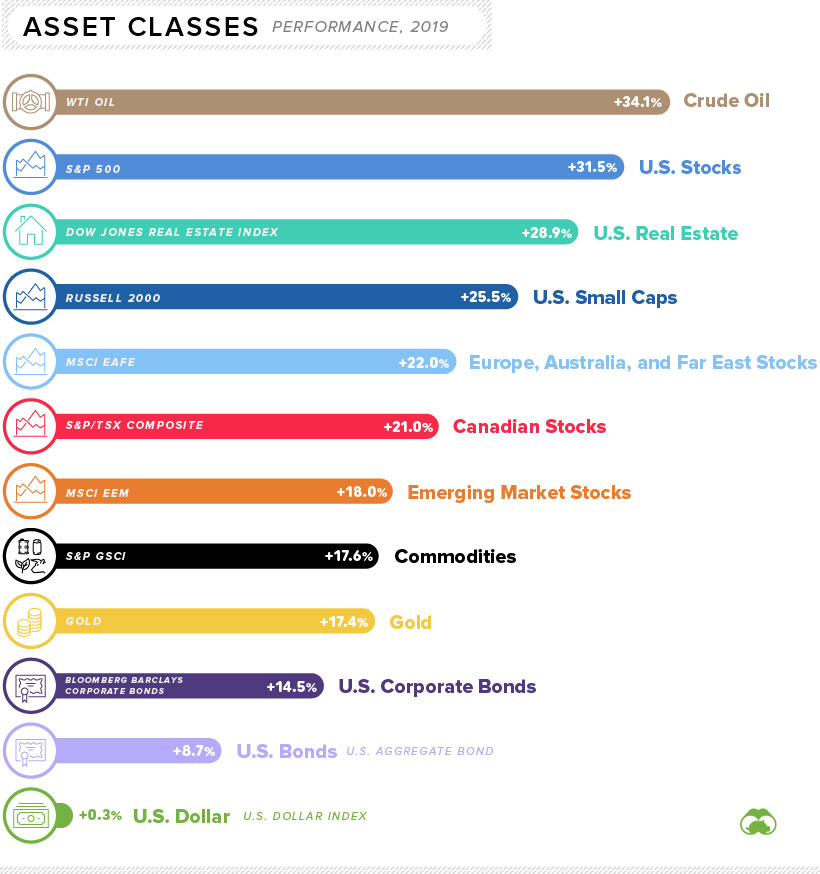
Let’s take a look at major asset classes in 2019, to see how they fared:
Note: all indices here (i.e. S&P 500, Russell 2000, etc.) are using total returns, with dividends re-invested. The first thing you’ll notice when looking at the above data is that every major asset class had a positive return for the year. The only real difference lies in the magnitude of that positive return. Even though stocks experienced some of the best gains on the year, the winning asset may be a surprising one: crude oil. The oil price (WTI) started the year at about $46/bbl and it closed the year at over $61/bbl, good for a 34% gain. And with escalating tensions between the U.S. and Iran, energy prices could be shooting even higher in 2020.
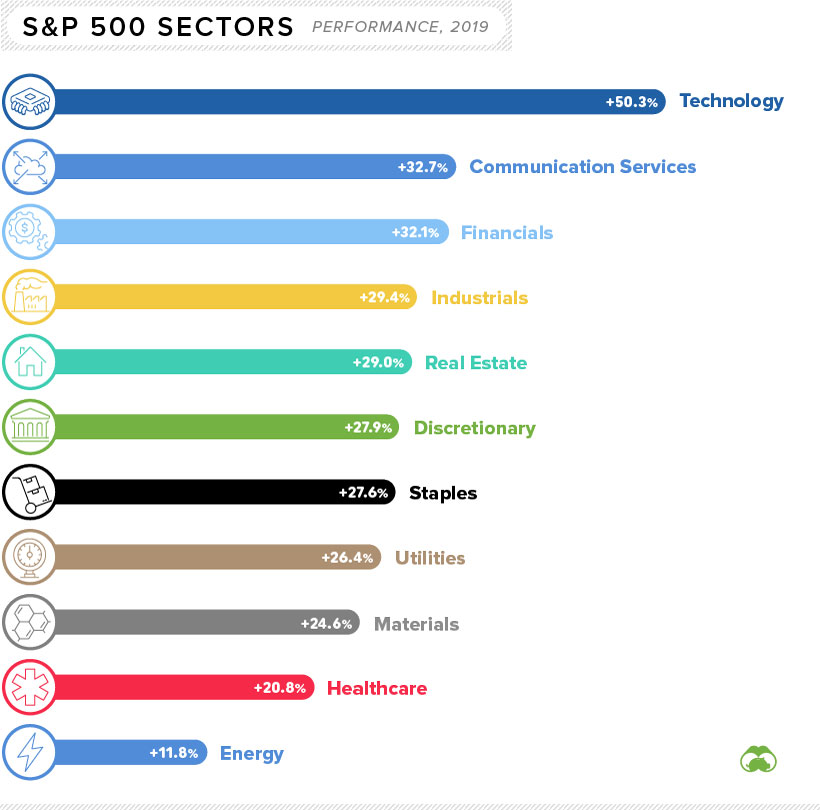
Performance by S&P 500 Sector
Strangely enough, rising oil prices did not do enough to buoy energy stocks — the poorest performing S&P 500 sector. Although oil was up on the year, natural gas actually fell in price by about 26% in 2019. This effectively cancels out the gains made by oil, putting energy producers at the bottom of the list:
Not surprisingly, technology stocks excelled in 2019. Tech was led by a big bounceback from Apple, a big winner that gained more than 80% over the course of the year. Other strong sectors in the benchmark U.S. index included communication services and financials.
The Currency Game
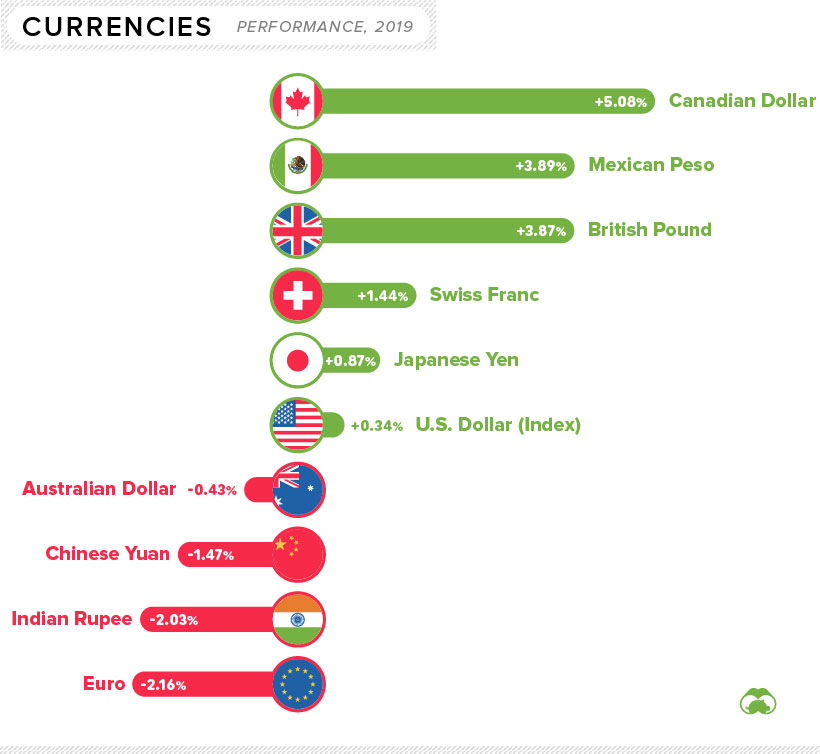
Now let’s look how currencies moved in 2019. Below movements are all against the U.S. dollar, with the exception of the U.S. dollar itself, which is measured against a basket of currencies (U.S. Dollar Index):
The biggest currency mover on the year was the Canadian dollar, which jumped over 5% partially thanks to rising oil prices. Meanwhile, the biggest decrease went to the euro, which fell over 2% against the U.S. dollar. It’s also worthwhile to note that Bitcoin had a particularly strong rebound in 2019, rising over 90% against the U.S. dollar.
Winners and Losers
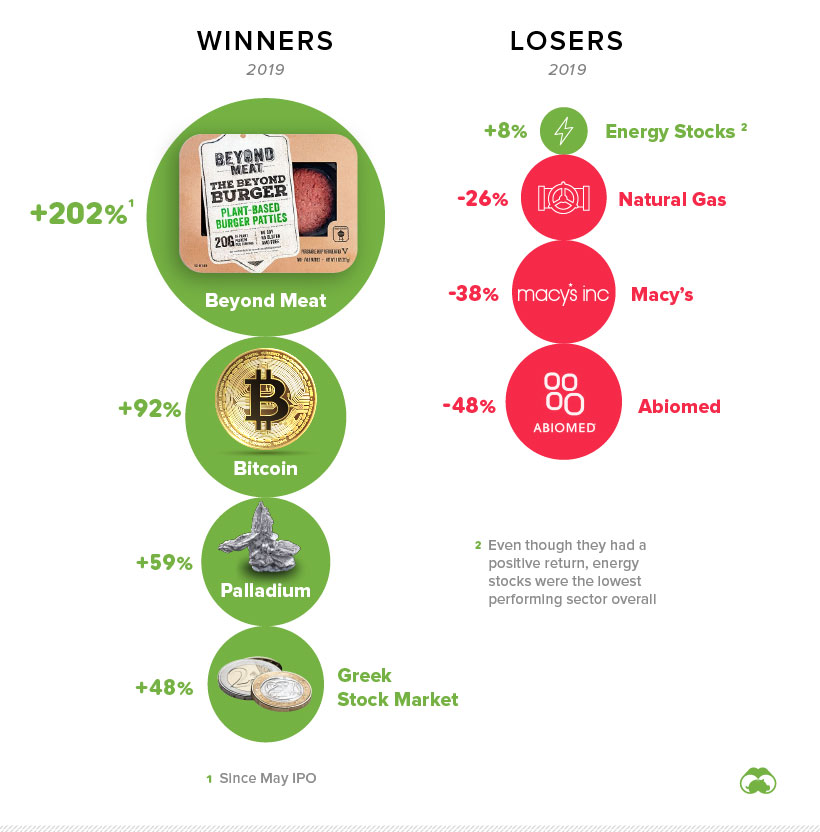
Finally, we’ve put together a more arbitrary list of winners and losers for the year, incorporating all of the above and more.
Both the Greek and Russian stock markets had banner years, each returning close to 50% in dollar terms. Faux meat brands also captured investors’ imaginations, with Beyond Meat leading the charge. Palladium was a standout commodity, gaining 59% on the year. We’ve chosen energy stocks as a loser, since they were the poorest performing sector on the S&P 500. Meanwhile, Macy’s and Abiomed were two of the worst large cap stocks to own in 2019. on Last year, stock and bond returns tumbled after the Federal Reserve hiked interest rates at the fastest speed in 40 years. It was the first time in decades that both asset classes posted negative annual investment returns in tandem. Over four decades, this has happened 2.4% of the time across any 12-month rolling period. To look at how various stock and bond asset allocations have performed over history—and their broader correlations—the above graphic charts their best, worst, and average returns, using data from Vanguard.
How Has Asset Allocation Impacted Returns?
Based on data between 1926 and 2019, the table below looks at the spectrum of market returns of different asset allocations:
We can see that a portfolio made entirely of stocks returned 10.3% on average, the highest across all asset allocations. Of course, this came with wider return variance, hitting an annual low of -43% and a high of 54%.
A traditional 60/40 portfolio—which has lost its luster in recent years as low interest rates have led to lower bond returns—saw an average historical return of 8.8%. As interest rates have climbed in recent years, this may widen its appeal once again as bond returns may rise.
Meanwhile, a 100% bond portfolio averaged 5.3% in annual returns over the period. Bonds typically serve as a hedge against portfolio losses thanks to their typically negative historical correlation to stocks.
A Closer Look at Historical Correlations
To understand how 2022 was an outlier in terms of asset correlations we can look at the graphic below:
The last time stocks and bonds moved together in a negative direction was in 1969. At the time, inflation was accelerating and the Fed was hiking interest rates to cool rising costs. In fact, historically, when inflation surges, stocks and bonds have often moved in similar directions. Underscoring this divergence is real interest rate volatility. When real interest rates are a driving force in the market, as we have seen in the last year, it hurts both stock and bond returns. This is because higher interest rates can reduce the future cash flows of these investments. Adding another layer is the level of risk appetite among investors. When the economic outlook is uncertain and interest rate volatility is high, investors are more likely to take risk off their portfolios and demand higher returns for taking on higher risk. This can push down equity and bond prices. On the other hand, if the economic outlook is positive, investors may be willing to take on more risk, in turn potentially boosting equity prices.
Current Investment Returns in Context
Today, financial markets are seeing sharp swings as the ripple effects of higher interest rates are sinking in. For investors, historical data provides insight on long-term asset allocation trends. Over the last century, cycles of high interest rates have come and gone. Both equity and bond investment returns have been resilient for investors who stay the course.