Far from a new concept, misinformation and cherry-picked stories have been used throughout history as a form of propaganda or information warfare. However, the rise of social media as a hub for sharing articles has spread “fake news”—false or misleading information presented as legitimate news—all over the internet. Fueled further by increasing polarization, as well as the use of the term by former U.S. President Donald Trump to also refer to negative coverage (whether legitimate or misinformed), it seems more difficult than ever to separate trustworthy from misleading sources. With this in mind, we combined guidance from non-profit journalism project First Draft News and the International Federation of Library Associations and Institutions (IFLA) to create this guide for understanding “fake news” and how to spot it.
The Different Types of “Fake News”
In order to spot fake news, you have to know the many forms misinformation can take. Not all fake news is created equal, or even with the intent to deceive. Some start as opinions or jokes that become misunderstood, twisted over time, and eventually turn into misinformation. Others begin with the sole purpose of deception.
Online Misinformation From Least Intentional to Most
Satire/Parody Articles or videos created to mock or laugh at an issue. If created without being an obvious parody, these types of articles can still fool readers and be shared as “real.” False Connection Stories with headlines, visuals, and captions that don’t support the content. Sometimes the cause is an honest mistake or poor journalism, but other times the false connections are deliberate to draw more attention. Misleading Content Misleading use of information to frame an issue or individual, especially one not involved in the story. This can be caused by poor journalism or political influence, but is also caused by opinions being shared as news and the increasingly blurring line between the two. False Context Genuine content that is shared with false contextual information, such as an incorrect date or a misattributed quote. This type of misinformation can still appear on news sites with poor fact-checking or opinion-based reporting, but is clearly driven by an agenda with an attempt to influence. Imposter Content When genuine sources are impersonated in order to deceive the audience. Though this type of misinformation is used in parody, it is also used for profit and propaganda purposes, such as by sites disguised to look like news organizations or using fake credentials. Manipulated Content The deliberate manipulation of information, such as digitally altering an image or making up quotes. This type of misinformation is easily proven fake with some research, but can spread too far before it is fact-checked. Fabricated Content Newly created false content designed to deceive and do harm. These include deepfake videos and sites posing as legitimate news organizations.
Despite many types of misinformation appearing to be obvious at a glance, it’s harder to discern when browsing online. In a 2019 global survey on social media by Ipsos, 44% of people admitted to being duped by fake news at least once, while others may have been duped unwittingly. And one reason is that fake or provocative news are simply being spread further, and more maliciously. A recent study of one Facebook bot farm found close to 14 thousand bots published around 200 thousand posts each month.
How To Tell If An Article is “Fake News”
With many types of misinformation to contend with, and trust in media organizations falling in the U.S. and around the world, it might seem like you’re surrounded by “fake news,” but there are a few things you can check to be sure.
The Source Investigate the site to make sure it’s legitimate, and check its mission and its contact info to understand if it’s news, satire, or opinion. The URL Be wary of unusual top-level domain names, like “.com.co” that are designed to appear legitimate, such as ABCnews.com.co. The Text Does the article have spelling errors or dramatic punctuation? This can be an easy find for simple fabricated content, as most reputable sources have high proofreading and grammatical standards. The Information Read past click-baity headlines, note who is (or isn’t) quoted, and verify the information on other sites. This is also a good way to separate opinion pieces from news. The Author Check the author’s bio and do a quick search on them. Are they credible to write about their story? Are they real? Supporting Sources Click on the supporting links, and perform reverse searches on images. Do they actually support the story, or are they irrelevant (or worse, manipulated). The Date Sometimes older news stories are shared again and gain traction because of current events, but that doesn’t mean they’re relevant or accurate. Your Bias Especially with the rise of opinionated journalism and websites profiting from polarization, consider the intended audience for this story and if your own beliefs could affect your judgement. The Experts If a story feels flimsy, or doesn’t seem to be properly cited, consider asking an expert in the field or consulting a fact-checking site.
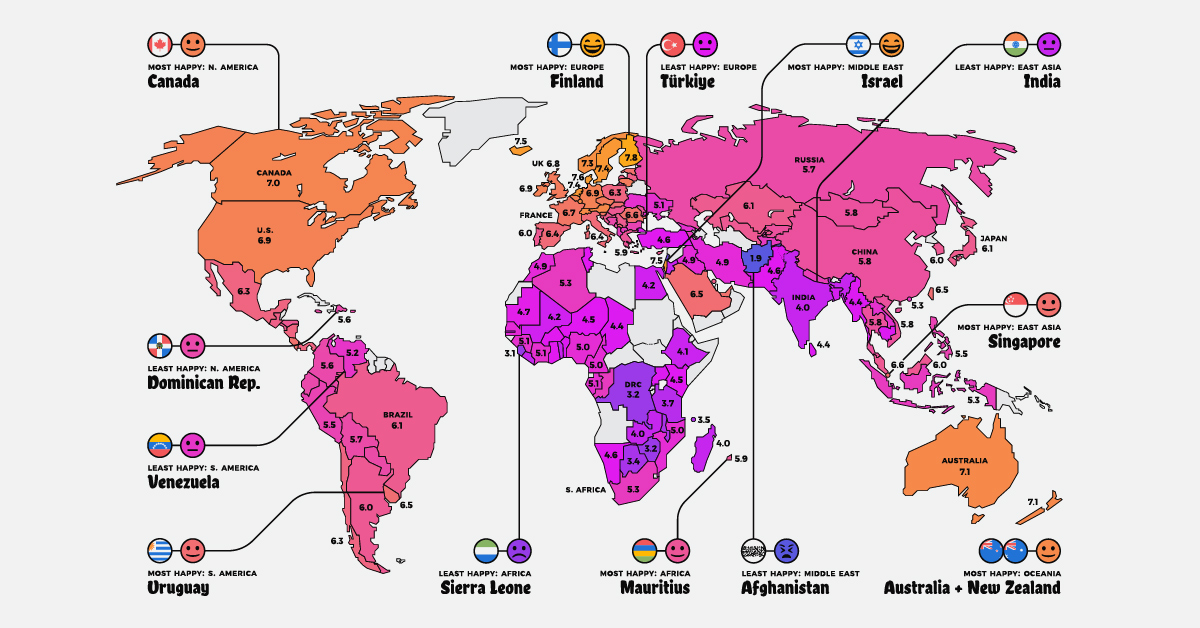
More than anything, consider that outrageous misinformation has an easier time spreading on the internet than boring real news. An MIT study found that false stories on Twitter were 70% more likely to get retweeted than accurate news. But armed with knowledge about what “fake news” looks like, and with increased pressure on news organizations, the tide can be turned back in the favor of accurate news. on Are wealth and prosperity legitimate measures of happiness? How about safety and health outcomes? In the West, we view democracy as a key component to happiness, yet there are countries under authoritarian rule that score high in the Happiness Index. Questions like these make “ranking happiness” a particularly challenging puzzle, but also one worth pursuing. If policymakers have a clearer picture of what conditions can foster happiness, they can enact policies that can improve the lives of people living their jurisdictions. The map above is a global snapshot of life satisfaction around the world. It utilizes the World Happiness Report—an annual survey of how satisfied citizens are worldwide—to map out the world’s happiest and least happy countries. To create the index the map is based on, researchers simply asked people how satisfied they are with their lives. Scores were assigned using these self-reported answers from people living within various countries, as well as quality of life factors. While there may be no perfect measure of happiness around the world, the report is a robust and transparent attempt to understand happiness at the global level. For more detailed notes on the report’s methodology and more, we recommend viewing the info box at the end of this article. Now, let’s look at the world’s happiest countries in 2023.
Global Happiness, by Country
Global happiness currently averages out to 5.5 out of 10, a decrease of 0.1 from last year. Below is a look at every country’s score: Note: Scores have been rounded to the first decimal place. European countries make up the bulk of the top 10, with Israel (#4) and New Zealand (#10) also making it into the top ranks. Finland sits at the very top of the ranking for the sixth year in a row. Now let’s look at the world’s happiest countries on a more regional basis.
North America
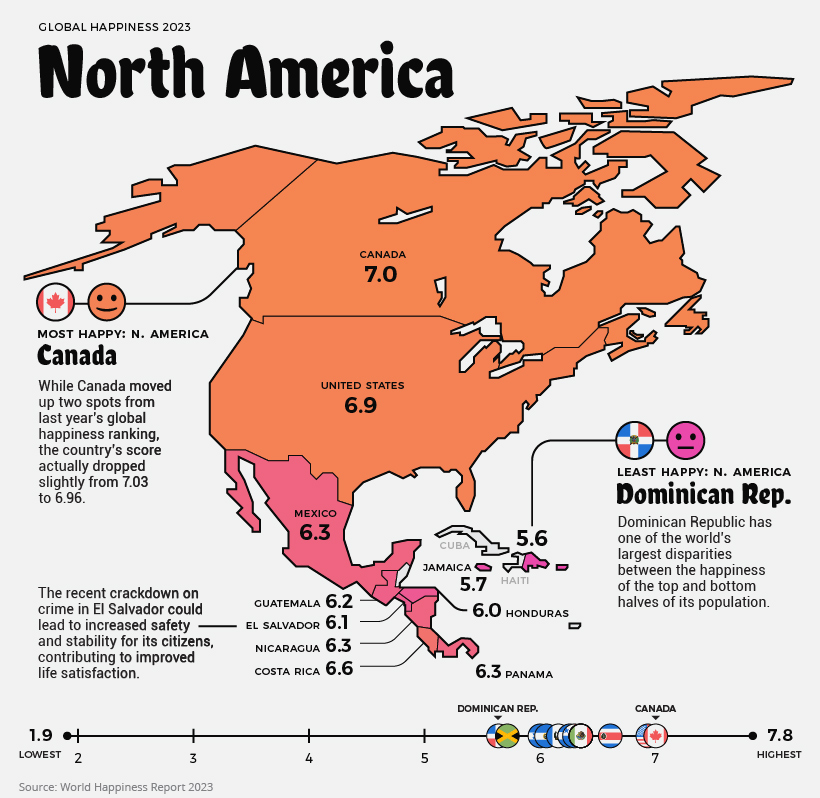
Current Mood: Happy (6.3)
North America’s happiness score averages out to 6.3/10. The happiest country in the region is Canada, slightly beating out the United States. However, the scores of both countries have actually decreased from last year. It’s difficult to pinpoint why citizens feel less satisfied, but inflation, economic uncertainty, and many other factors could play a role. The only countries to see improvement in North America were Nicaragua and Jamaica. Although a more recent development, many Jamaicans could be experiencing even more happiness in the near future, with a recent announcement of plans to increase the minimum wage by 44%.
South America
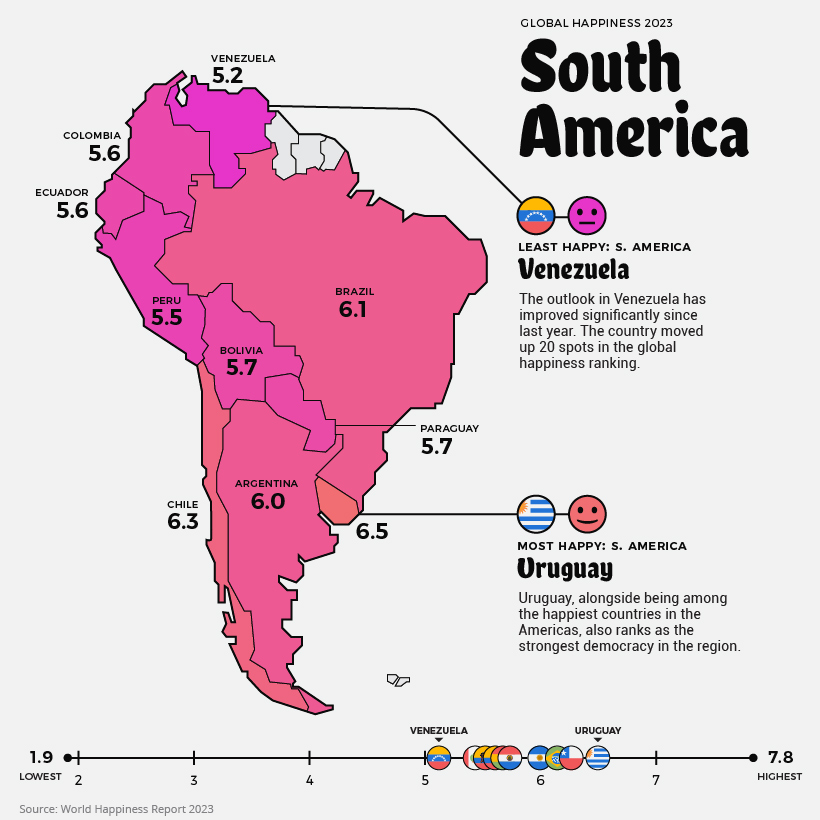
Current Mood: Content (5.8)
South America’s average score is 5.8. Although Venezuela is the continent’s least happy country, its score actually improved from 4.9 to 5.2. That said, the ongoing humanitarian and economic crisis is not likely to instill much hope into the average Venezuelan. Over 6.8 million people have fled the struggling nation since 2014. The two countries in the region with decreased scores were Brazil and Colombia, where citizens have reported feeling worse compared to the year before.
Europe
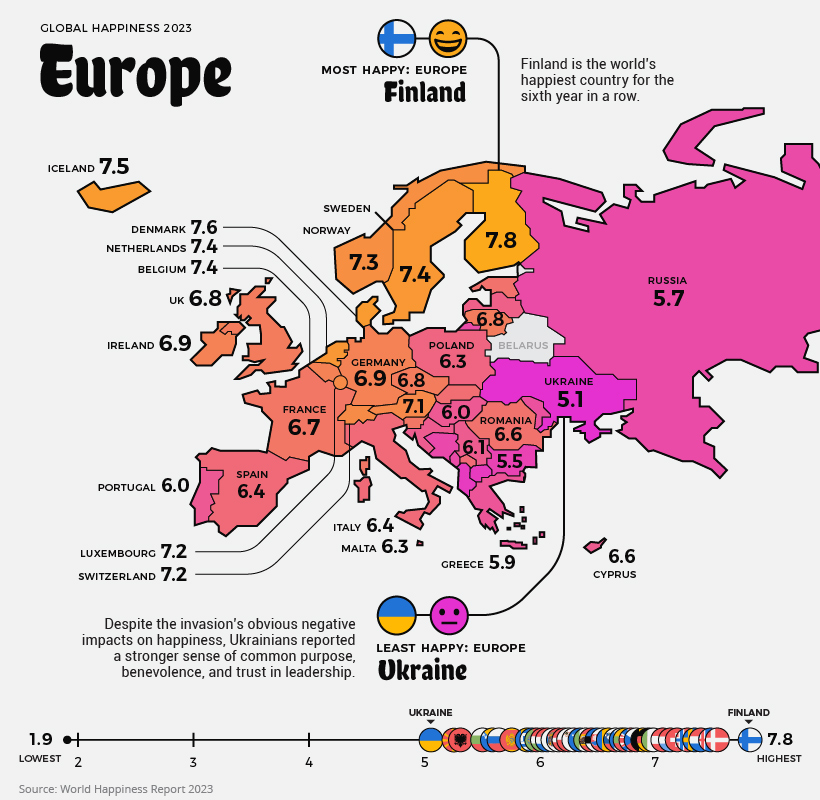
Current Mood: Happy (6.4)
Europe has some of the world’s happiest countries, with an average regional score of 6.4. Nordic countries like Finland, Sweden, and Iceland repeatedly report high scores, meaning people in these countries feel extremely satisfied with their lives.
Despite fending off an invasion, Ukrainians saw no diminishment of their happiness year-over-year, and many are feeling resilient and purposeful in their fight for freedom. Interestingly, Russia’s score actually increased slightly compared to last year, going from 5.5 to 5.7.
East Asia and Oceania
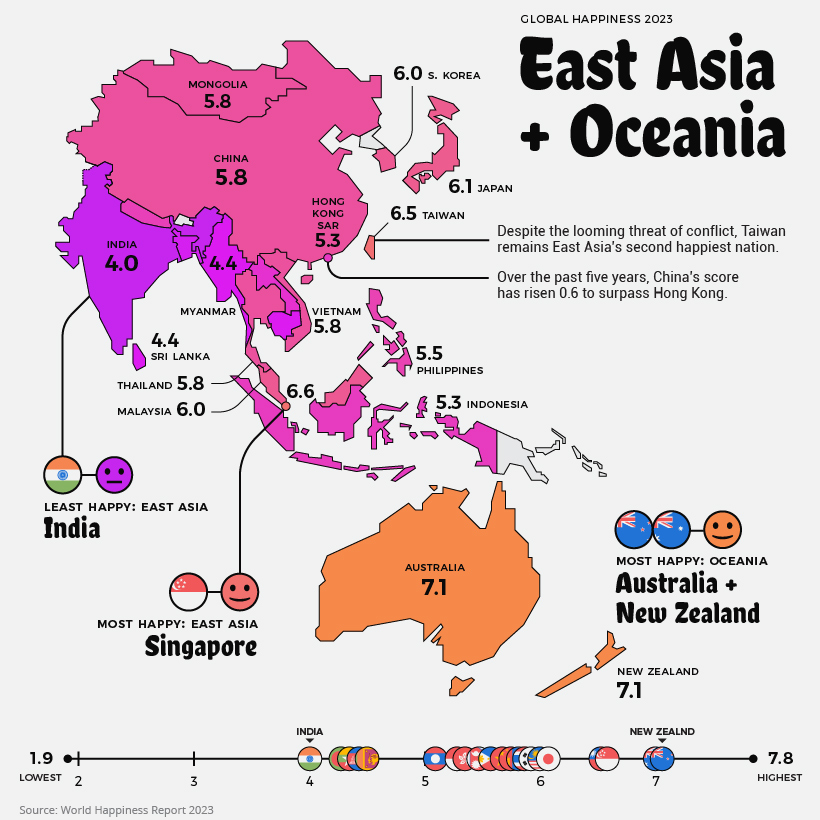
Current Mood: Neutral (5.6)
East Asia and Oceania’s collective average is 5.6. Oceania alone, however, would have the highest regional score in the world, at 7.1. Bucking conventional wisdom—at least in the West—China has seen a noteworthy bump (+0.6) in its score in recent years. Across the strait, Taiwan records the second highest score in East Asia, after Singapore. India once again has the lowest happiness score in its region. The country’s score has dropped -0.7 over the past decade.
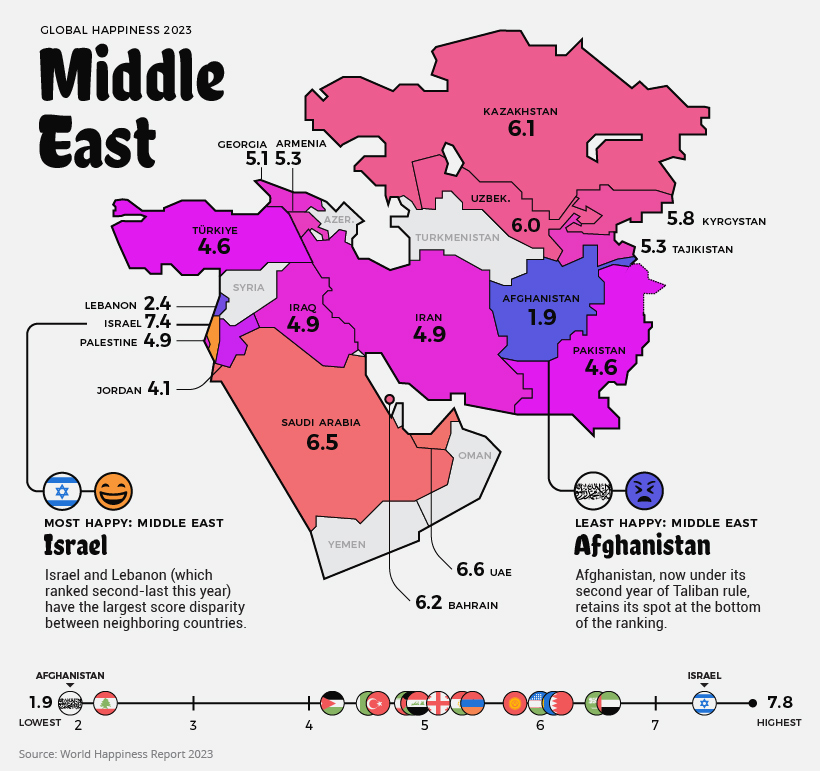
Central Asia and The Middle East
Current Mood: It’s Complicated (5.2)
The average score in the Middle East and Central Asia is 5.2, and the array of happiness scores is wider than in any other region. Afghanistan is the world’s least happy country, with citizens having reported extremely low levels of life satisfaction. Since the Taliban takeover, life has become objectively worse for Afghans, particularly women. There is a lot of conflict in the region. Citizens of Armenia face particular tension with neighboring Azerbaijan, whose score was not recorded for this year. Conflicts in the Nagorno-Karabakh region have led to hundreds of deaths since 2020 and cause daily struggle for those who live in the disputed territory. Iran is still under economic sanctions and faces ongoing tensions with the U.S. and Israel. Some countries, like Syria and Yemen, are so destabilized that no data is available. Still, there are bright spots as well. Israel has one of the world’s happiest countries with a top 10 score this year, and Saudi Arabia and the UAE have scores on par with many European countries.
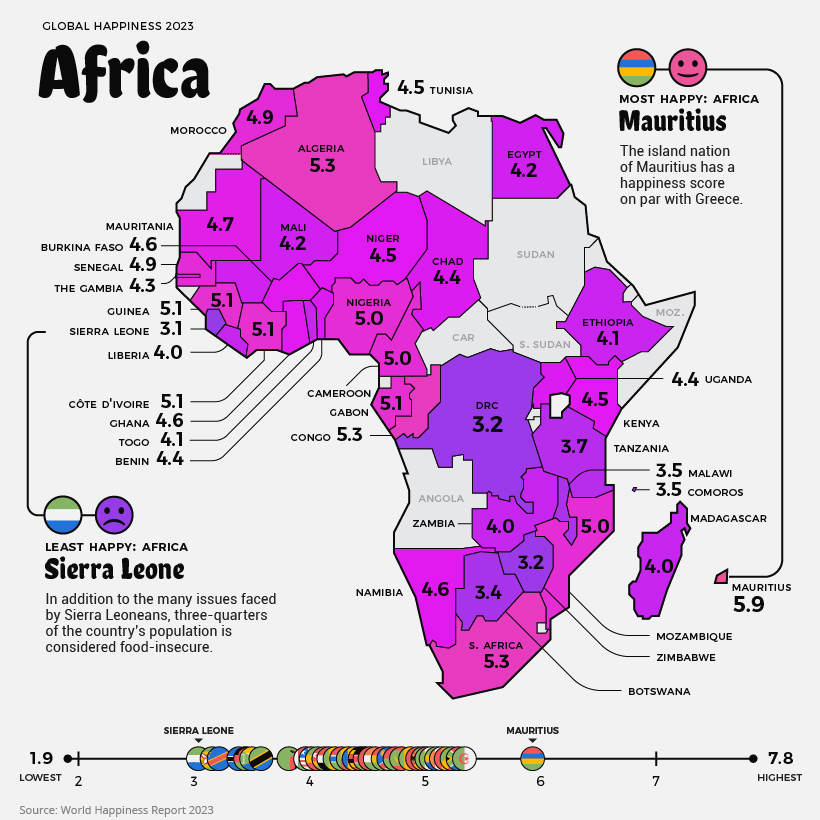
Africa
Current Mood: Unhappy (4.4)
The least happy region, Africa, averages out to a score of 4.4, and there is a lot of regional variation. The highest score in Africa goes to the island nation of Mauritius. In addition to the country’s natural beauty and stability, there is growing economic opportunity. Mauritius is classified as an upper-middle-income country by World Bank, and is one of the fastest growing high-income markets in the world. Sierra Leone has the lowest score of African countries that were included in the index, followed by Zimbabwe and the Democratic Republic of the Congo. It’s worth noting, there are a few data gaps in the region, including Burundi, which is currently the poorest country in the world. Source: The World Happiness Report which leverages data from the Gallup World Poll. Methodology: A nationally representative group of approximately 1,000 people is asked a series of questions relating to their life satisfaction, as well as positive and negative emotions they are experiencing. The life evaluation question is based on the Cantril ladder, wherein the top of the ladder represents the best possible life for a person (a score of 10/10) and on the flipside, the worst possible life (scored as 0/10). The main takeaway is that the scores result from self-reported answers by citizens of each of these countries. The results received a confidence interval of 95%, meaning that there is a 95% chance that the answers and population surveyed represent the average. As well, scores are averaged over the past three years in order to increase the sample size of respondents in each country. Criticisms: Critics of the World Happiness Report point out that survey questions measure satisfaction with socioeconomic conditions as opposed to individual emotional happiness. As well, there are myriad cultural differences around the world that influence how people think about happiness and life satisfaction. Finally, there can be big differences in life satisfaction between groups within a country, which are averaged out even in a nationally representative group. The report does acknowledge inequality as a factor by measuring the “gap” between the most and least happy halves of each country.