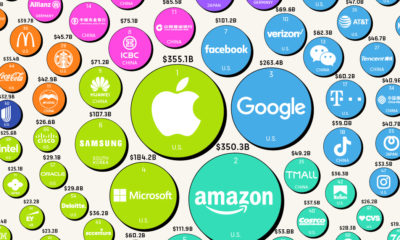
However, the COVID-19 pandemic has resulted in the major upheaval of advertising spend, and it is unlikely to recover for some time. The graphic above uses data from Ad Age’s Leading National Advertisers 2020 which measures U.S. advertising spend each year, and ranks 100 national advertisers by their total spend in 2019. Let’s take a look at the brands with the biggest budgets.
2019’s Biggest Advertising Spenders
Explore the 100 biggest advertisers in 2019 below: The report offers several ways of looking at this data—for example, when looking at highest spend by medium, Procter & Gamble comes out on top for traditional media spend like broadcast and cable TV.
The Rise and Fall of Advertising Spend
Interestingly, changes in advertising spend tend to fall closely in step with broader economic growth. In fact, for every 1% increase in U.S. GDP, there is a 4.4% rise of advertising that occurs in tandem. The same phenomenon can be seen among the biggest advertising spenders in the country. Since 2000, spend has seen both promising growth, and drastic declines. Unsurprisingly, the Great Recession resulted in the largest drop in spend ever recorded, and now it looks as though history may be repeating itself. Total advertising spend in the U.S. is estimated this year to see a brutal decline of almost 13% and is unlikely to return to previous levels for a number of years.
The COVID-19 Gut Punch
To say that the global COVID-19 pandemic has impacted consumer behavior would be an understatement, and perhaps the most notable change is how they now consume content. With more people staying safe indoors, there is less need for traditional media formats such as out-of-home advertising. As a result, online media is taking its place, as an increase in spend for this format shows. But despite marketers trying to optimize their media strategy or stripping back their budget entirely, many governments across the world are ramping up their spend on advertising to promote public health messages—or in the case of the U.S., to canvass.
The Saving Grace?
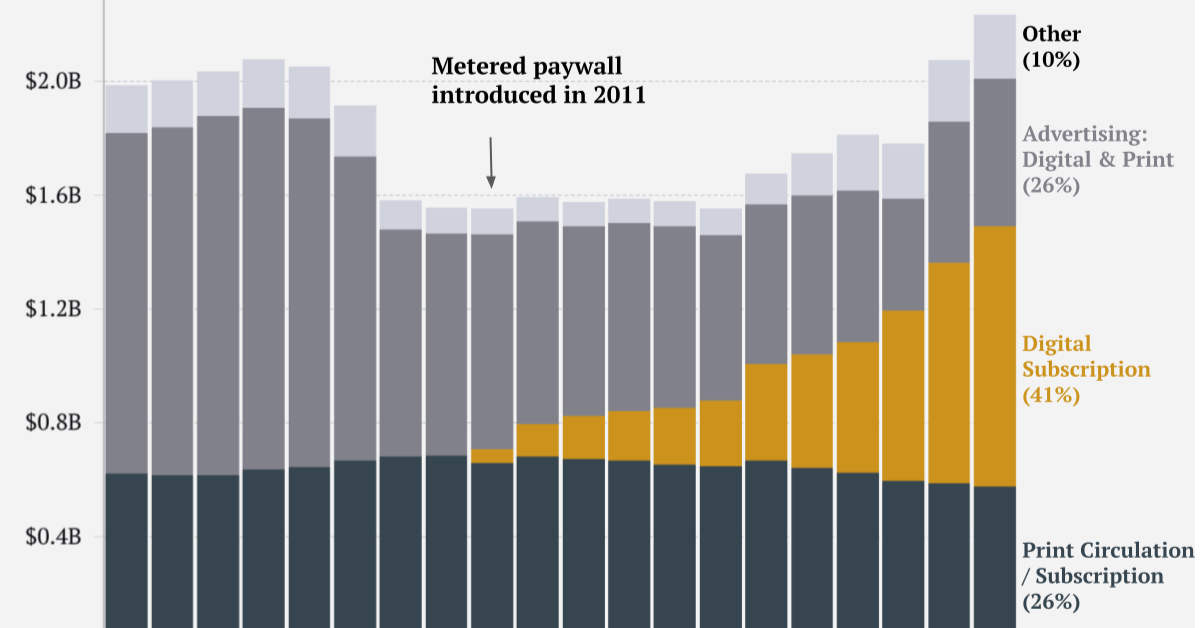
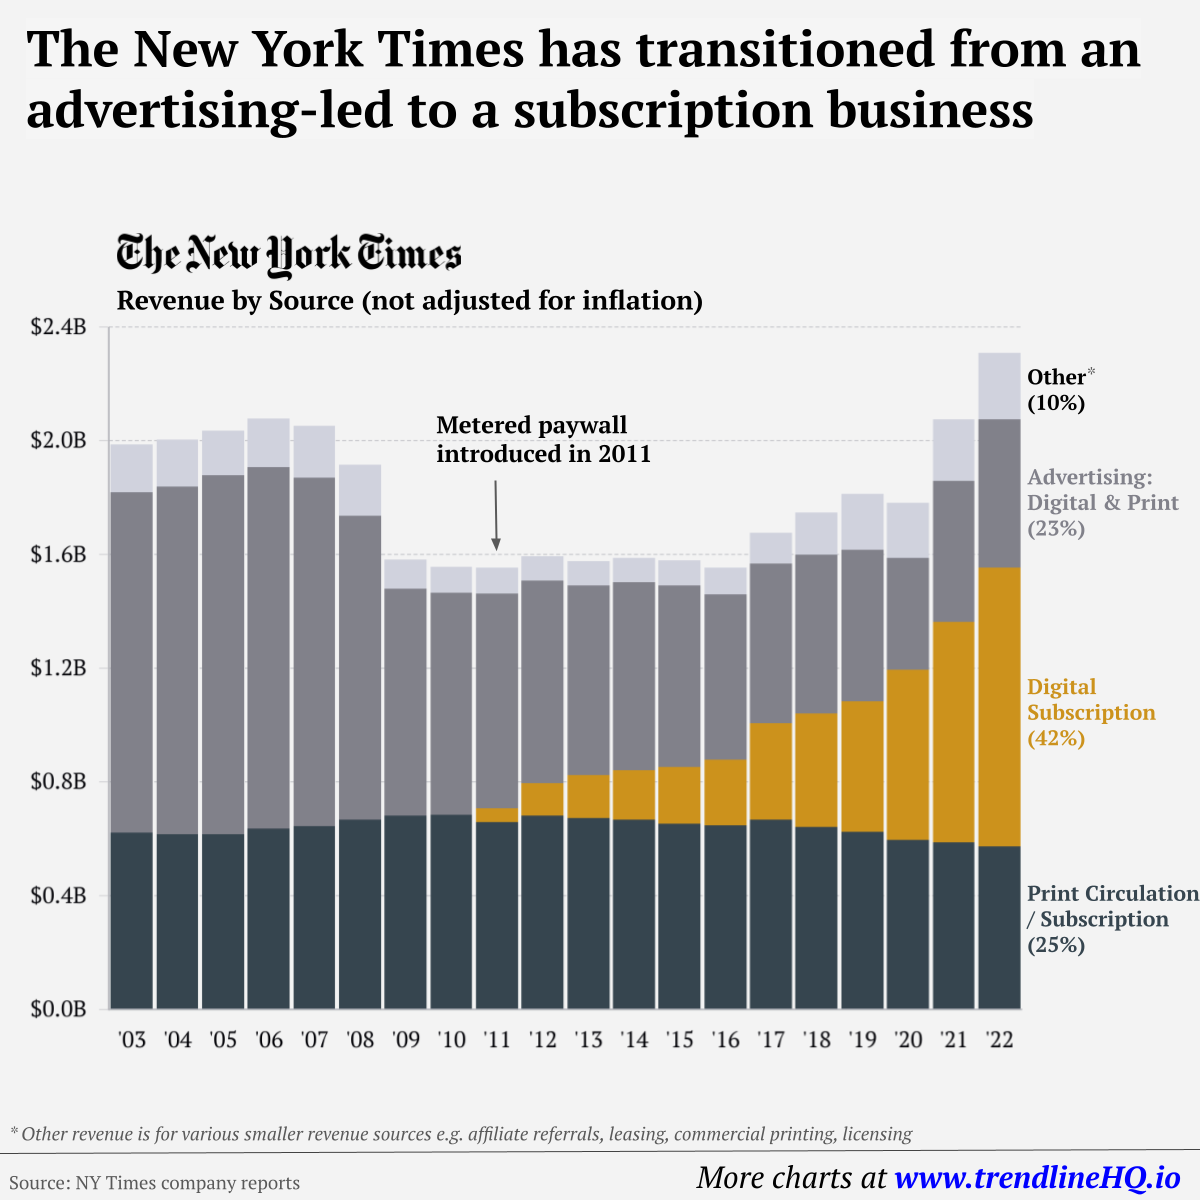
Even though advertising spend is expected to nosedive by almost 13% in 2020, this figure excludes political advertising. When taking that into account, the decline becomes a slightly more manageable 7.6% Can political advertising be the key to the advertising industry bouncing back again? on Similar to the the precedent set by the music industry, many news outlets have also been figuring out how to transition into a paid digital monetization model. Over the past decade or so, The New York Times (NY Times)—one of the world’s most iconic and widely read news organizations—has been transforming its revenue model to fit this trend. This chart from creator Trendline uses annual reports from the The New York Times Company to visualize how this seemingly simple transition helped the organization adapt to the digital era.
The New York Times’ Revenue Transition
The NY Times has always been one of the world’s most-widely circulated papers. Before the launch of its digital subscription model, it earned half its revenue from print and online advertisements. The rest of its income came in through circulation and other avenues including licensing, referrals, commercial printing, events, and so on. But after annual revenues dropped by more than $500 million from 2006 to 2010, something had to change. In 2011, the NY Times launched its new digital subscription model and put some of its online articles behind a paywall. It bet that consumers would be willing to pay for quality content. And while it faced a rocky start, with revenue through print circulation and advertising slowly dwindling and some consumers frustrated that once-available content was now paywalled, its income through digital subscriptions began to climb. After digital subscription revenues first launched in 2011, they totaled to $47 million of revenue in their first year. By 2022 they had climbed to $979 million and accounted for 42% of total revenue.
Why Are Readers Paying for News?
More than half of U.S. adults subscribe to the news in some format. That (perhaps surprisingly) includes around four out of 10 adults under the age of 35. One of the main reasons cited for this was the consistency of publications in covering a variety of news topics. And given the NY Times’ popularity, it’s no surprise that it recently ranked as the most popular news subscription.