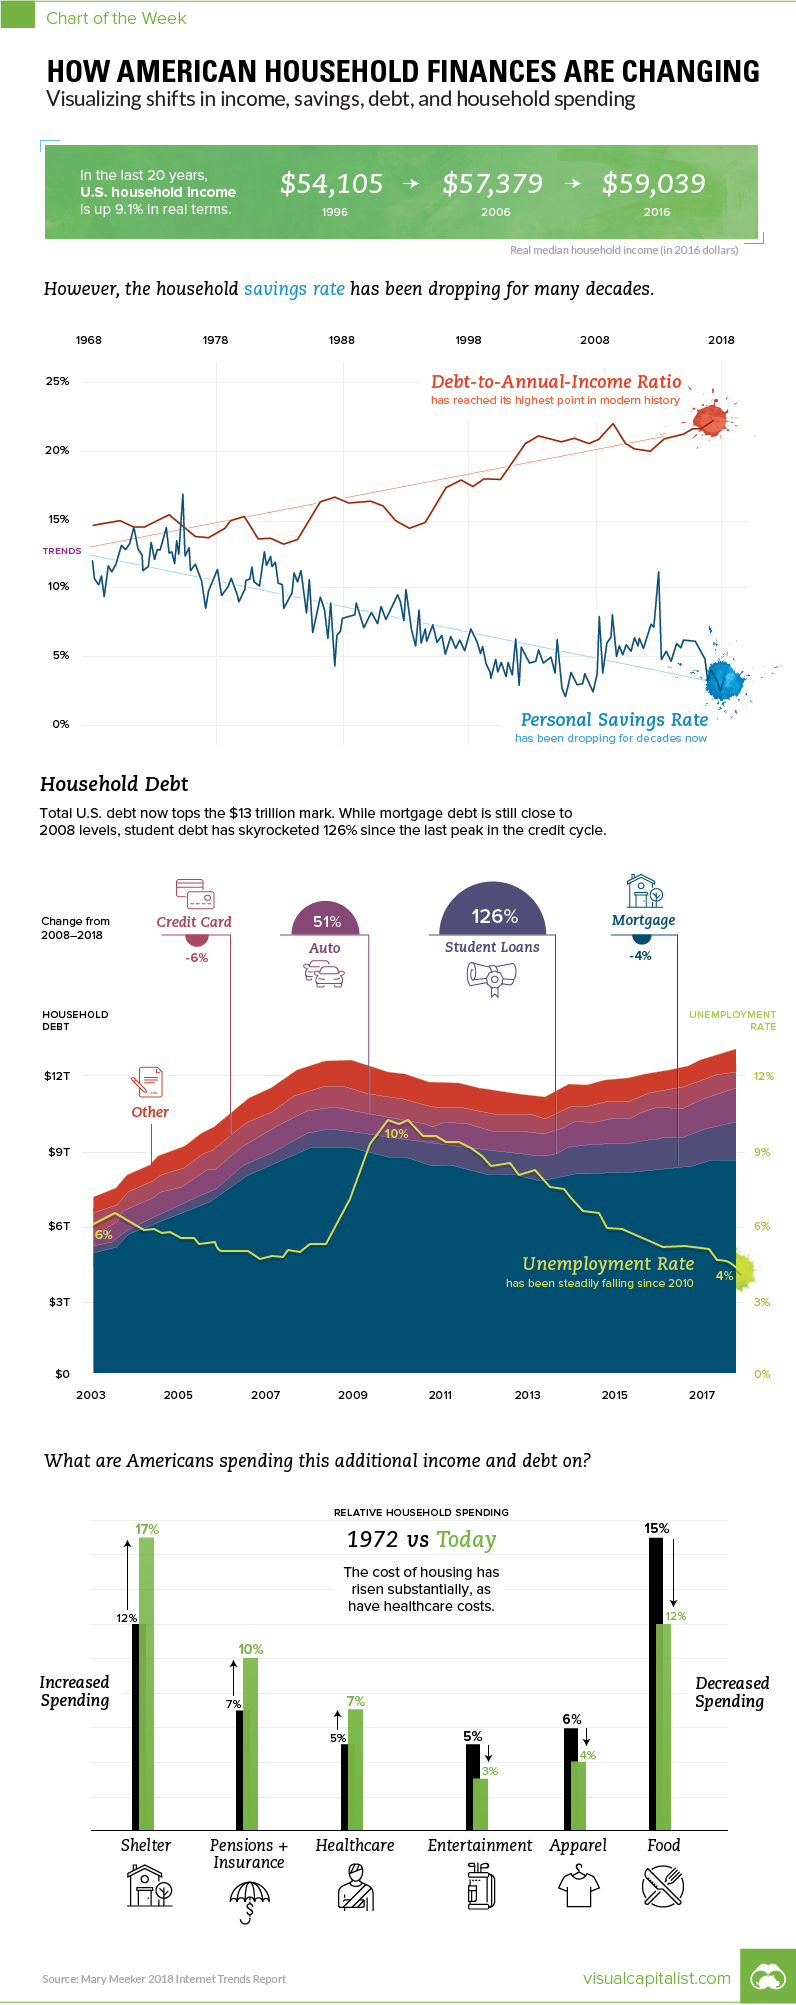
How American Household Finances are Changing
Visualizing shifts in income, savings, debt, and spending
The Chart of the Week is a weekly Visual Capitalist feature on Fridays. Every year, Silicon Valley patiently waits for Mary Meeker from Kleiner Perkins to share her famous Internet Trends report. The latest rendition came out two days ago. As usual, the 294-slide deck is a treasure trove of the the latest data on technology and internet trends. But while the report is well-known as a barometer on the internet, it also features some high-level data on the U.S. economy that we found interesting. As a result, we used some of the most compelling slides to put together this week’s chart on how American household finances are changing – and we greatly thank Mary for doing the heavy lifting.
From Peak to Peak
In 2007, real median household income had a local peak of $58,149, and then fell off a cliff at the same time as the credit cycle, which reached its own peak in 2008 Q3 as the financial crisis set in. Real median household income bottomed in 2012, and then debt followed in 2013. Looking at the most recent year of data available, both categories are now back above pre-crisis highs. Real median household income has now surpassed its all-time record in 1999 – and total household debt has topped $13 trillion in 2018 Q1, more than $500 billion higher than its previous peak in 2008.
A Closer Look
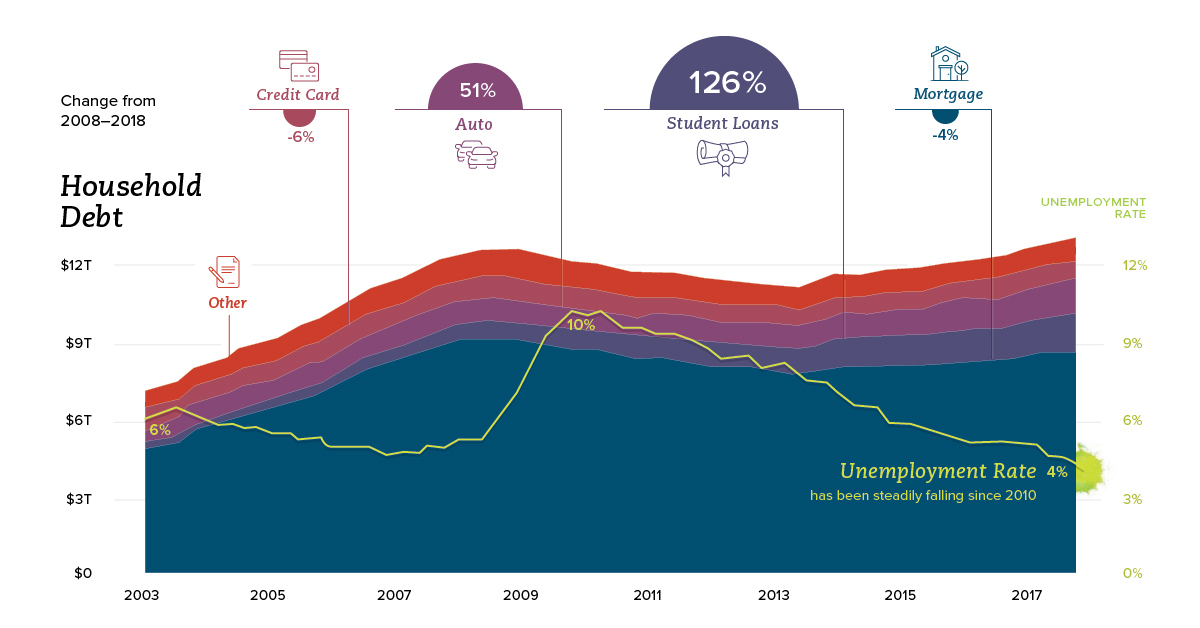
While consumer debt is similar in terms of total size from a decade ago, the composition has changed considerably. Mortgage debt, which makes up the vast majority of consumer debt, is still actually down from its 2008 peak by 4%. Replacing that is other forms of debt, including student loans:
Since 2008, student loan debt has surged by 131% – and auto loans by 52%. Mortgage debt, credit debt, and other non-housing debt have not yet crawled back to pre-crisis peaks.
Saving and Spending
Looking at the longer-term trend, Americans are borrowing more and saving fewer dollars. In the 1970s, both rates were about the same as a percentage of income, falling in a range between 13-15%. Today, the savings rate is below 5%, and debt-to-annual income ratio has risen to 22%, according to Meeker. What are American households spending money on? Notably, households are spending more on shelter and healthcare – meanwhile, the cost for food, entertainment, and apparel are decreasing over time.
on Today’s chart measures the extent to which 41 major economies are reopening, by plotting two metrics for each country: the mobility rate and the COVID-19 recovery rate: Data for the first measure comes from Google’s COVID-19 Community Mobility Reports, which relies on aggregated, anonymous location history data from individuals. Note that China does not show up in the graphic as the government bans Google services. COVID-19 recovery rates rely on values from CoronaTracker, using aggregated information from multiple global and governmental databases such as WHO and CDC.
Reopening Economies, One Step at a Time
In general, the higher the mobility rate, the more economic activity this signifies. In most cases, mobility rate also correlates with a higher rate of recovered people in the population. Here’s how these countries fare based on the above metrics. Mobility data as of May 21, 2020 (Latest available). COVID-19 case data as of May 29, 2020. In the main scatterplot visualization, we’ve taken things a step further, assigning these countries into four distinct quadrants:
1. High Mobility, High Recovery
High recovery rates are resulting in lifted restrictions for countries in this quadrant, and people are steadily returning to work. New Zealand has earned praise for its early and effective pandemic response, allowing it to curtail the total number of cases. This has resulted in a 98% recovery rate, the highest of all countries. After almost 50 days of lockdown, the government is recommending a flexible four-day work week to boost the economy back up.
2. High Mobility, Low Recovery
Despite low COVID-19 related recoveries, mobility rates of countries in this quadrant remain higher than average. Some countries have loosened lockdown measures, while others did not have strict measures in place to begin with. Brazil is an interesting case study to consider here. After deferring lockdown decisions to state and local levels, the country is now averaging the highest number of daily cases out of any country. On May 28th, for example, the country had 24,151 new cases and 1,067 new deaths.
3. Low Mobility, High Recovery
Countries in this quadrant are playing it safe, and holding off on reopening their economies until the population has fully recovered. Italy, the once-epicenter for the crisis in Europe is understandably wary of cases rising back up to critical levels. As a result, it has opted to keep its activity to a minimum to try and boost the 65% recovery rate, even as it slowly emerges from over 10 weeks of lockdown.
4. Low Mobility, Low Recovery
Last but not least, people in these countries are cautiously remaining indoors as their governments continue to work on crisis response. With a low 0.05% recovery rate, the United Kingdom has no immediate plans to reopen. A two-week lag time in reporting discharged patients from NHS services may also be contributing to this low number. Although new cases are leveling off, the country has the highest coronavirus-caused death toll across Europe. The U.S. also sits in this quadrant with over 1.7 million cases and counting. Recently, some states have opted to ease restrictions on social and business activity, which could potentially result in case numbers climbing back up. Over in Sweden, a controversial herd immunity strategy meant that the country continued business as usual amid the rest of Europe’s heightened regulations. Sweden’s COVID-19 recovery rate sits at only 13.9%, and the country’s -93% mobility rate implies that people have been taking their own precautions.
COVID-19’s Impact on the Future
It’s important to note that a “second wave” of new cases could upend plans to reopen economies. As countries reckon with these competing risks of health and economic activity, there is no clear answer around the right path to take. COVID-19 is a catalyst for an entirely different future, but interestingly, it’s one that has been in the works for a while. —Carmen Reinhart, incoming Chief Economist for the World Bank Will there be any chance of returning to “normal” as we know it?