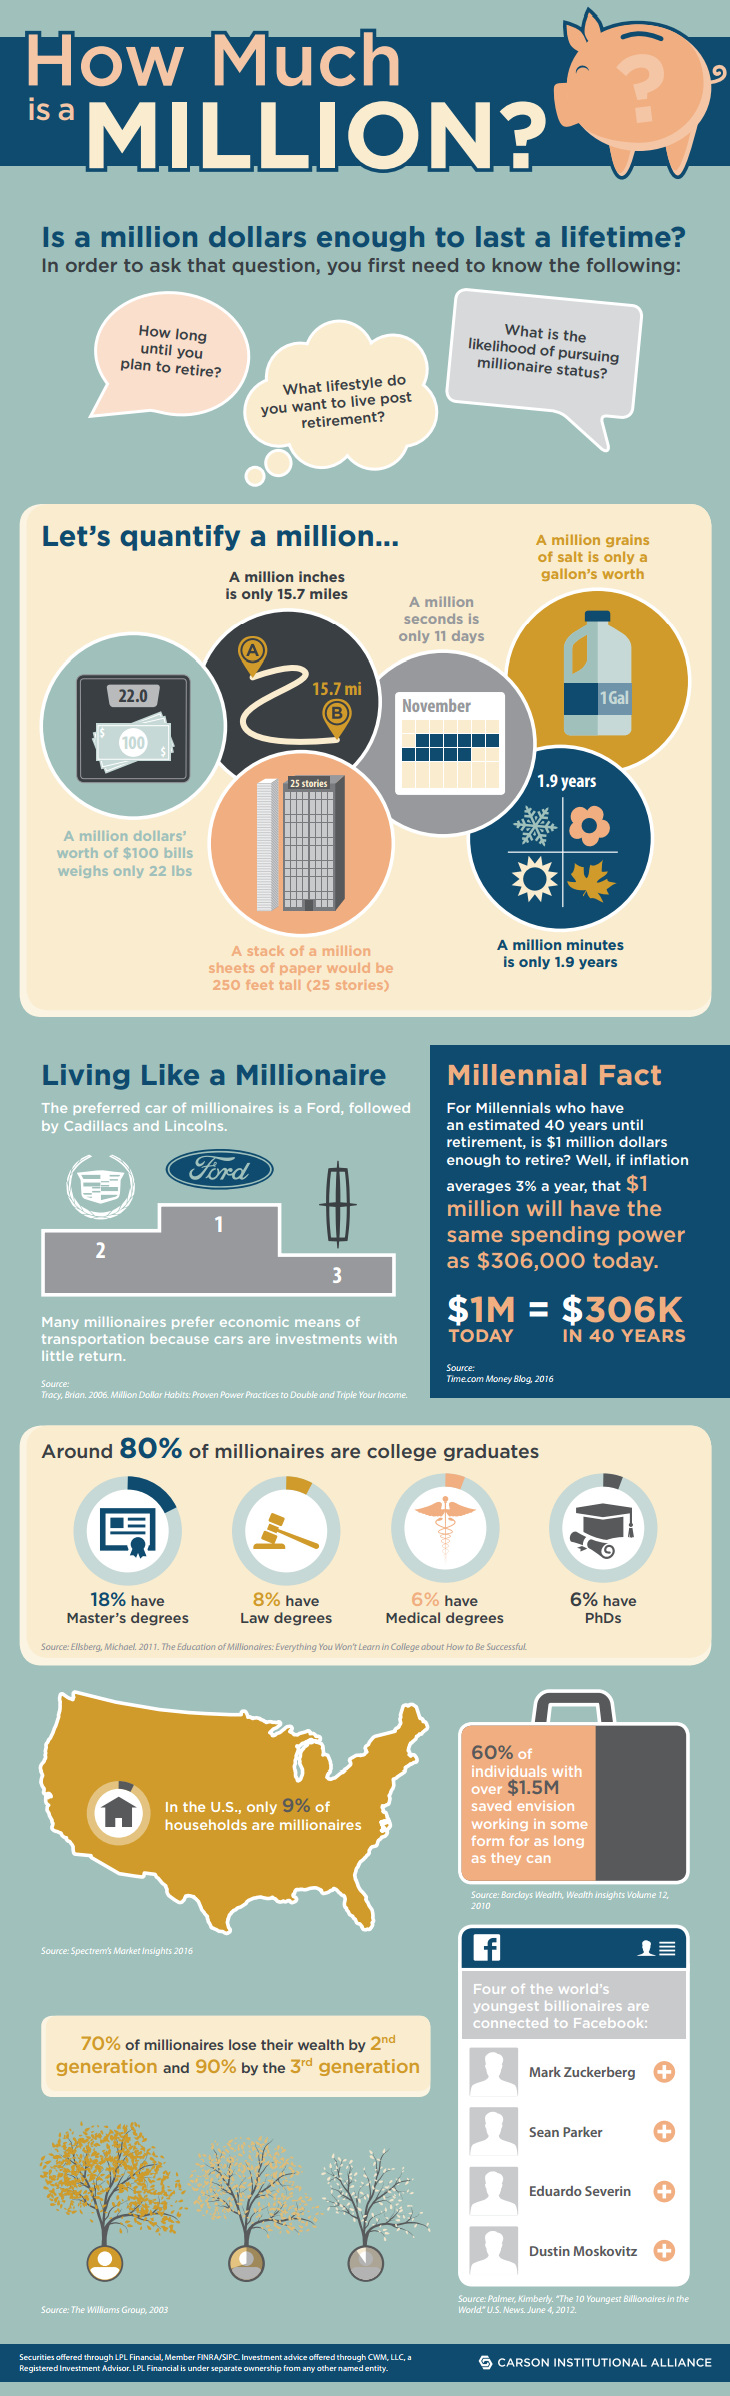
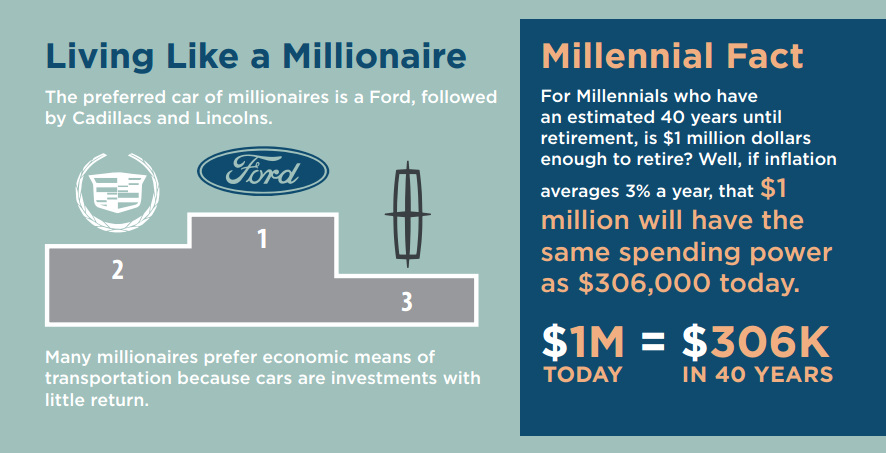
The term itself has quite a few connotations, including many that have been ingrained in us since we were children. Becoming a “millionaire” meant being set for life, and not having to worry about things like personal finances again. After all, millionaires are supposed to be destined for early retirement, right? That was then, and this is now. Time magazine recently estimated that for a millennial with 40 years until retirement, $1 million in savings is not likely sufficient. Taking into account 3% inflation over that time period, it would be worth just $306,000 in today’s dollars. That’s a pretty questionable nest egg for a “millionaire”.
How Much is a Million Dollars?
The infographic from Carson Wealth shows that things have changed over time, and that a million dollars of wealth ain’t what it used to be. Fun facts: the preferred car for millionaires is actually a Ford, and the majority of millionaires envision working all the way until their retirement.
In today’s world, reaching the magical “millionaire” mark of a $1 million net worth is less meaningful than it used to be. In fact, roughly 9% of households in the United States have “millionaires” living in them – this is a record amount, caused partially through the devaluation of currency over time. That said, there are many cities (San Francisco, Vancouver, New York, London, Melbourne, Tokyo, etc.) where even a million dollars isn’t even enough to purchase a home. The “millionaire” case is a stark example of the erosion of a dollar’s purchasing power over time. To get a full sense, take a look at some historical numbers:
To have the purchasing power of a millionaire from the 1900s, you would need at have nearly $30 million in today’s dollars. To have the same impact or influence on the economy as a millionaire from the 1900s, you’d need closer to $100 million in today’s dollars.
For more perspective on the topic, see how much money exists with this video from The Money Project:
on To see how the minimum wage differs around the world, we’ve visualized data from Picodi, which includes values for 67 countries as of January 2023.
Monthly Minimum Wage, by Country
The following table includes all of the data used in this infographic. Each value represents the monthly minimum wage a full-time worker would receive in each country. Picodi states that these figures are net of taxes and have been converted to USD. Generally speaking, developed countries have a higher cost of living, and thus require a higher minimum wage. Two outliers in this dataset are Argentina and Turkey, which have increased their minimum wages by 100% or more from January 2022 levels. Turkey is suffering from an ongoing currency crisis, with the lira losing over 40% of its value in 2021. Prices of basic goods have increased considerably as the Turkish lira continues to plummet. In fact, a 2022 survey found that 70% of people in Turkey were struggling to pay for food. Argentina, South America’s second-biggest economy, is also suffering from very high inflation. In response, the country announced three minimum wage increases throughout 2022.
Minimum Wage in the U.S.
Within the U.S., minimum wage varies significantly by state. We’ve visualized each state’s basic minimum rate (hourly) using January 2023 data from the U.S. Department of Labor.
2023-03-17 Update: This map was updated to fix several incorrect values. We apologize for any confusion this may have caused. America’s federal minimum wage has remained unchanged since 2009 at $7.25 per hour. Each state is allowed to set their own minimum wage, as long as it’s higher than the federal minimum. In states that do not set their own minimum, the federal minimum applies. If we assume someone works 40 hours a week, the federal minimum wage of $7.25 translates to an annual figure of just $15,080 before taxes. California’s minimum wage of $15.50 translates to $32,240 before taxes. For further perspective, check out our 2022 infographic on the salary needed to buy a home across 50 U.S. cities.