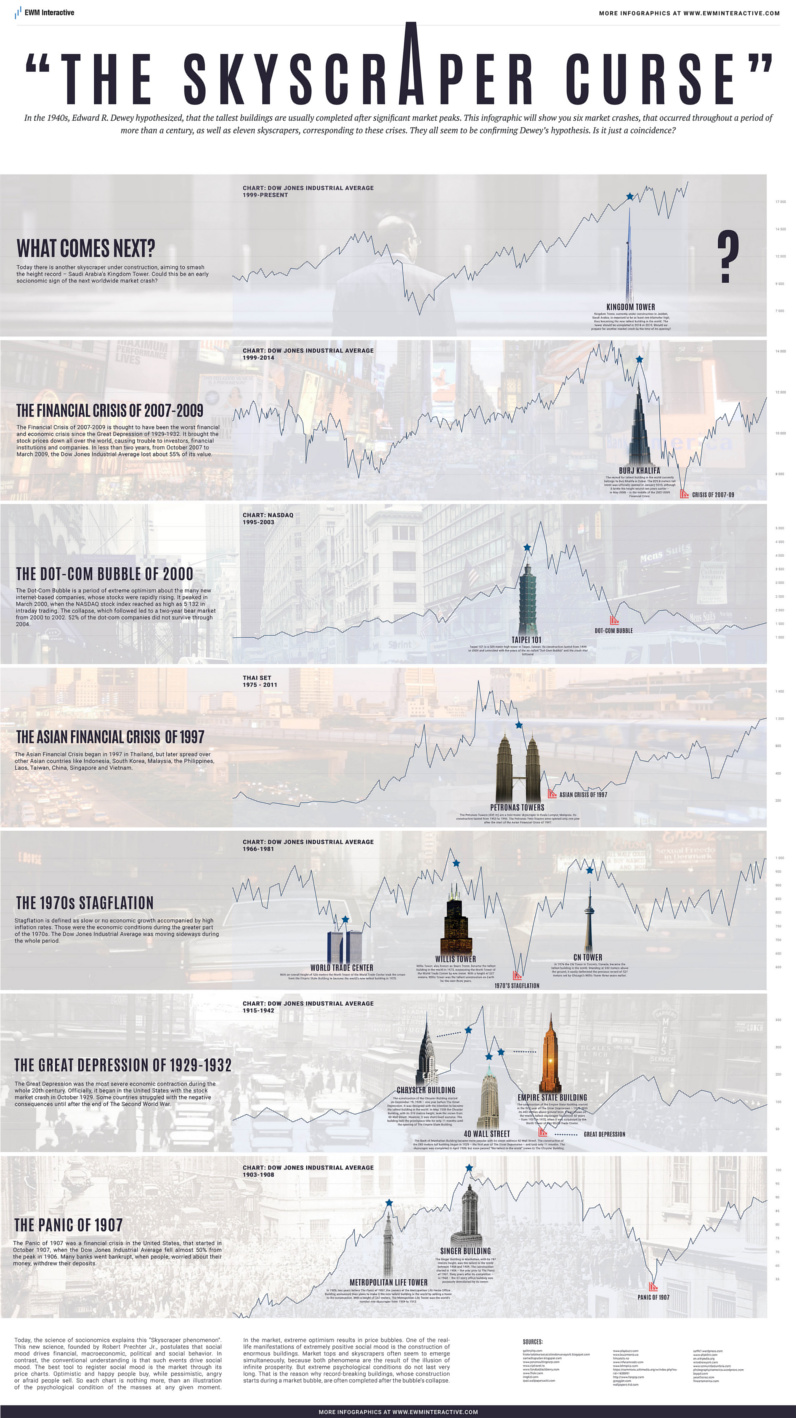
It’s the tallest skyscraper in the world at 828m (2,717 ft), and it was completed in 2009. The price tag was a whopping $1.5 billion, making it one of the most expensive buildings of all time. For these bold projects to get the go ahead, global financial conditions have to be just right. Record-breaking skyscrapers can take multiple years to build, and things can change drastically from start to finish. In this case, construction of the Burj Khalifa started in 2004. By the time it was completed, however, the financial markets were in ruins. Lehman had collapsed, and rescue efforts such as TARP and QE were in full force to try and stop the bleeding. Between October 2007 and March 2009, the Dow Jones Industrial Average lost 55% of value. The crisis didn’t only bankrupt financial markets – it also took its toll on competing projects that aimed to unseat the Burj Khalifa as the world’s height record-holder. For example, One Dubai Tower A was supposed to be a whopping 1,008m (3,307 ft) tall – but it was shelved in March 2009 once it was clear that global financial conditions would not be improving any time soon.
Do Newly Built Skyscrapers Signal The Top of the Stock Market?
Could record-setting skyscrapers signal economic over-expansion and a misallocation of capital? EWM Interactive, a subscription service focused on technical analysis, thinks so. The following infographic follows the “Skyscraper Curse” through six different market tops and subsequent crashes over the past century. It is gigantic in size, so please click here or the below image to access the legible version:
EWM Interactive sums up the infographic with these words: That said, there are counter-examples that show the “skyscraper theory” is not perfect. The recession after World War I, the recession of 1937, and the recession in the early 1980s were not correlated with any record-breaking skyscraper projects. An empirical test in 2015 that looked at the theory found that record-setting skyscrapers did not correspond directly with the business cycle. Let’s hope that they are right, since the Jeddah Tower – a 1,008m (3,307 ft) monster in Saudi Arabia – is expected to unseat the Burj Khalifa as the world’s tallest building by the year 2019.
on Last year, stock and bond returns tumbled after the Federal Reserve hiked interest rates at the fastest speed in 40 years. It was the first time in decades that both asset classes posted negative annual investment returns in tandem. Over four decades, this has happened 2.4% of the time across any 12-month rolling period. To look at how various stock and bond asset allocations have performed over history—and their broader correlations—the above graphic charts their best, worst, and average returns, using data from Vanguard.
How Has Asset Allocation Impacted Returns?
Based on data between 1926 and 2019, the table below looks at the spectrum of market returns of different asset allocations:
We can see that a portfolio made entirely of stocks returned 10.3% on average, the highest across all asset allocations. Of course, this came with wider return variance, hitting an annual low of -43% and a high of 54%.
A traditional 60/40 portfolio—which has lost its luster in recent years as low interest rates have led to lower bond returns—saw an average historical return of 8.8%. As interest rates have climbed in recent years, this may widen its appeal once again as bond returns may rise.
Meanwhile, a 100% bond portfolio averaged 5.3% in annual returns over the period. Bonds typically serve as a hedge against portfolio losses thanks to their typically negative historical correlation to stocks.
A Closer Look at Historical Correlations
To understand how 2022 was an outlier in terms of asset correlations we can look at the graphic below:
The last time stocks and bonds moved together in a negative direction was in 1969. At the time, inflation was accelerating and the Fed was hiking interest rates to cool rising costs. In fact, historically, when inflation surges, stocks and bonds have often moved in similar directions. Underscoring this divergence is real interest rate volatility. When real interest rates are a driving force in the market, as we have seen in the last year, it hurts both stock and bond returns. This is because higher interest rates can reduce the future cash flows of these investments. Adding another layer is the level of risk appetite among investors. When the economic outlook is uncertain and interest rate volatility is high, investors are more likely to take risk off their portfolios and demand higher returns for taking on higher risk. This can push down equity and bond prices. On the other hand, if the economic outlook is positive, investors may be willing to take on more risk, in turn potentially boosting equity prices.
Current Investment Returns in Context
Today, financial markets are seeing sharp swings as the ripple effects of higher interest rates are sinking in. For investors, historical data provides insight on long-term asset allocation trends. Over the last century, cycles of high interest rates have come and gone. Both equity and bond investment returns have been resilient for investors who stay the course.