Does America View Its Trade Relationships as Fair?
The Chart of the Week is a weekly Visual Capitalist feature on Fridays. Understandably, most people are not experts on the subject of trade. But while the average person won’t likely be able to guess the U.S. trade deficit with Mexico, perceptions of trade relationships in the public eye are still a crucial indicator. If the majority of Americans think they are getting the short end of the stick on international trade, this sentiment ultimately affects how politicians campaign, how policy decisions are made, and the success of the wider economy.
U.S. Perceptions of Trade
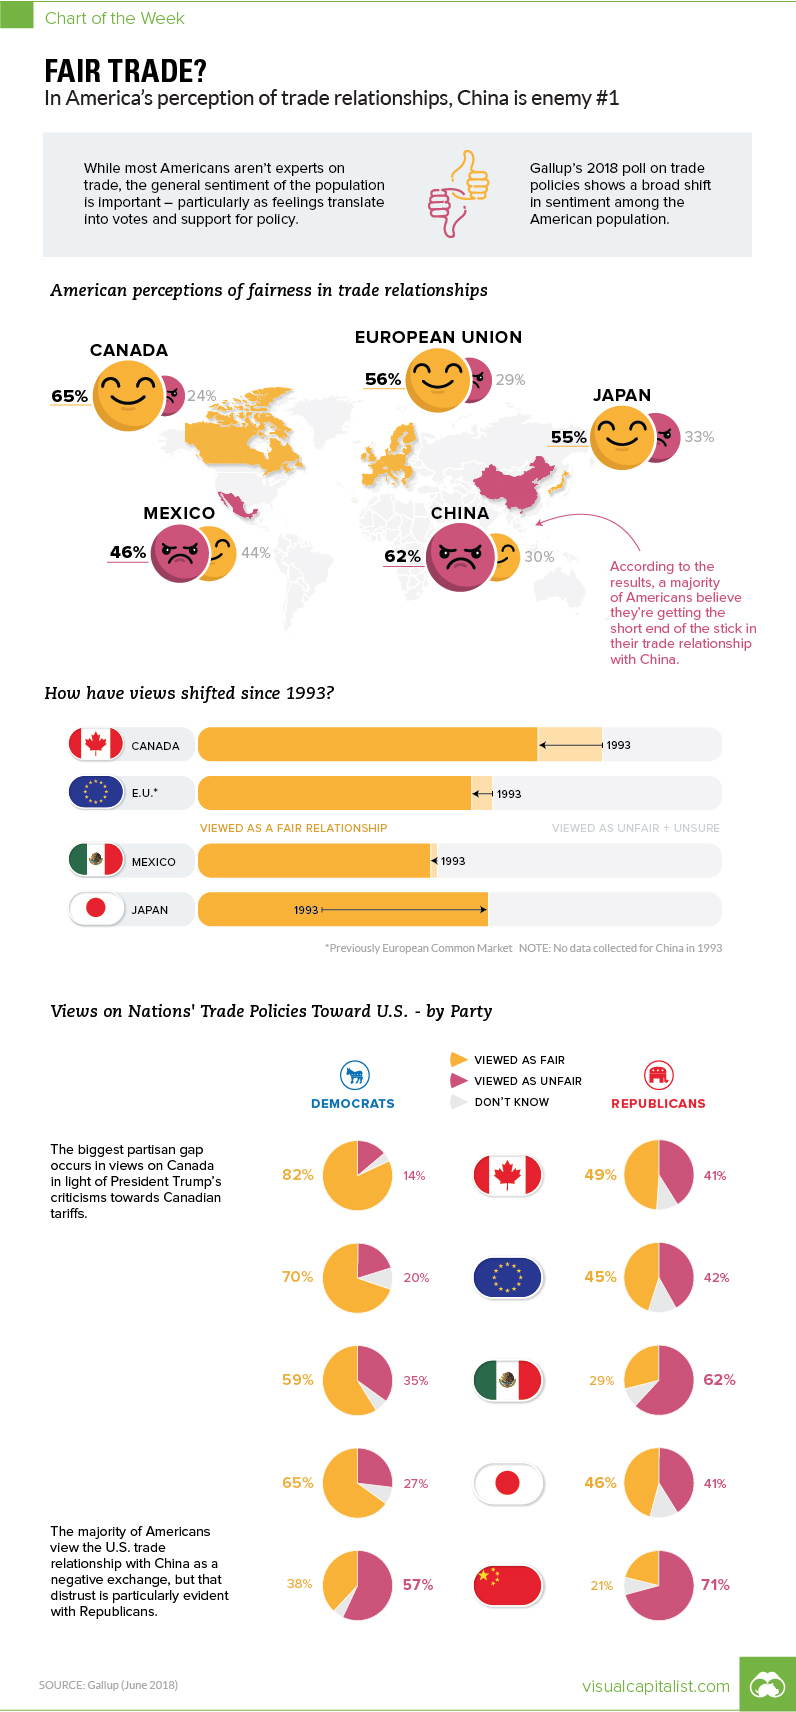
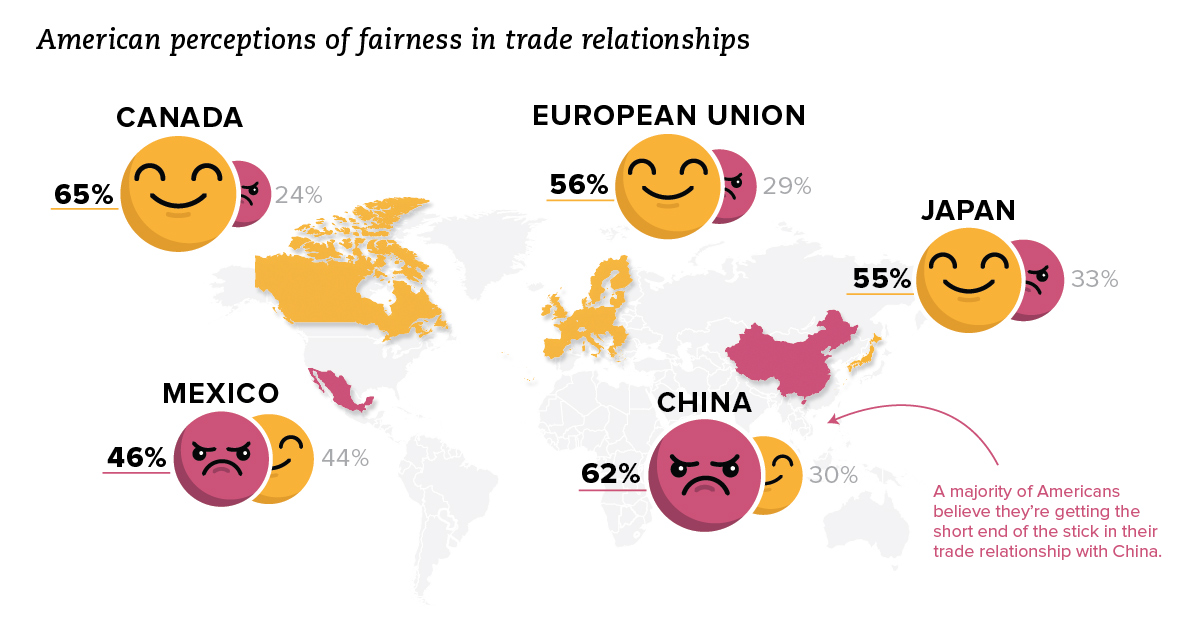
In today’s chart, we break down the data from a recent Gallup poll on how Americans view the country’s trade relationships. At a high level, here is how it looks by country:
The majority of Americans think relationships with Canada (65%), the European Union (56%), and Japan (55%) are fair. When it comes to Mexico, respondents are split (44% fair, 46% unfair). Meanwhile, it’s clear that most Americans think they are getting the short end of the stick with China, with 62% of respondents describing the relationship as unfair.
The China Problem
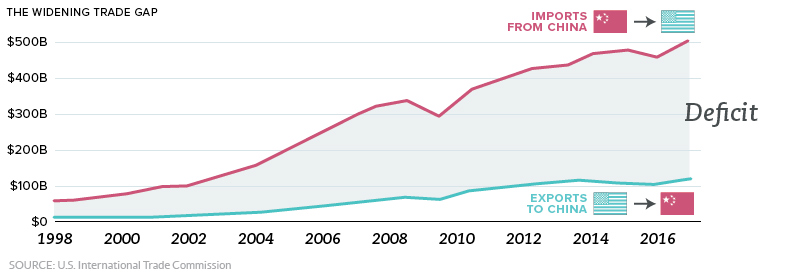
China is America’s largest trading partner, so this negative sentiment has meaningful implications. The balance of trade that the U.S. has with China is also crystal clear: in 2017, the two countries traded $636 billion of goods, but the vast majority of this number comes from Chinese imports into the United States:
Most economists actually think that trade deficits are less important than they appear, but this trade gap is also visceral for many people. After all, U.S. exports barely make a dent in the mix, and this sends a message that America is “losing”. Between the above trade deficit, intellectual property issues, and jobs going overseas, it’s understandable why the perception of Chinese-U.S. trade is under fire in terms of public sentiment. And with the start of the recent trade war, the view on China could sour even further.
The Partisan Perspective
Interestingly, Democrats and Republicans have very different views on U.S. relationships, including the one with China:
Comparing Republicans and Democrats, three different relationships have opinion gaps of about 30%: Canada, European Union, and Mexico. In all cases, Democrats favored the relationships far more than Republicans. That said, when it comes to China and Japan, the parties are slightly more aligned. Only a minority in both parties thought the U.S. trade relationship with China was fair, with 21% of Republicans and 38% of Democrats in agreement.
on The good news is that the Federal Reserve, U.S. Treasury, and Federal Deposit Insurance Corporation are taking action to restore confidence and take the appropriate measures to help provide stability in the market. With this in mind, the above infographic from New York Life Investments looks at the factors that impact bonds, how different types of bonds have historically performed across market environments, and the current bond market volatility in a broader context.
Bond Market Returns
Bonds had a historic year in 2022, posting one of the worst returns ever recorded. As interest rates rose at the fastest pace in 40 years, it pushed bond prices lower due to their inverse relationship. In a rare year, bonds dropped 13%.
Source: FactSet, 01/02/2023.
Bond prices are only one part of a bond’s total return—the other looks at the income a bond provides. As interest rates have increased in the last year, it has driven higher bond yields in 2023.
Source: YCharts, 3/20/2023.
With this recent performance in mind, let’s look at some other key factors that impact the bond market.
Factors Impacting Bond Markets
Interest rates play a central role in bond market dynamics. This is because they affect a bond’s price. When rates are rising, existing bonds with lower rates are less valuable and prices decline. When rates are dropping, existing bonds with higher rates are more valuable and their prices rise. In March, the Federal Reserve raised rates 25 basis points to fall within the 4.75%-5.00% range, a level not seen since September 2007. Here are projections for where the federal funds rate is headed in 2023:
Federal Reserve Projection*: 5.1% Economist Projections**: 5.3%
*Based on median estimates in the March summary of quarterly economic projections.**Projections based on March 10-15 Bloomberg economist survey. Together, interest rates and the macroenvironment can have a positive or negative effect on bonds.
Positive
Here are three variables that may affect bond prices in a positive direction:
Lower Inflation: Reduces likelihood of interest rate hikes. Lower Interest Rates: When rates are falling, bond prices are typically higher. Recession: Can prompt a cut in interest rates, boosting bond prices.
Negative
On the other hand, here are variables that may negatively impact bond prices:
Higher Inflation: Can increase the likelihood of the Federal Reserve to raise interest rates. Rising Interest Rates: Interest rate hikes lead bond prices to fall. Weaker Fundamentals: When a bond’s credit risk gets worse, its price can drop. Credit risk indicates the chance of a default, the risk of a bond issuer not making interest payments within a given time period.
Bonds have been impacted by these negative factors since inflation started rising in March 2021.
Fixed Income Opportunities
Below, we show the types of bonds that have had the best performance during rising rates and recessions.
Source: Derek Horstmeyer, George Mason University 12/3/2022. As we can see, U.S. ultrashort bonds performed the best during rising rates. Mortgage bonds outperformed during recessions, averaging 11.4% returns, but with higher volatility. U.S. long-term bonds had 7.7% average returns, the best across all market conditions. In fact, they were also a close second during recessions. When rates are rising, ultrashort bonds allow investors to capture higher rates when they mature, often with lower historical volatility.
A Closer Look at Bond Market Volatility
While bond market volatility has jumped this year, current dislocations may provide investment opportunities. Bond dislocations allow investors to buy at lower prices, factoring in that the fundamental quality of the bond remains strong. With this in mind, here are two areas of the bond market that may provide opportunities for investors:
Investment-Grade Corporate Bonds: Higher credit quality makes them potentially less vulnerable to increasing interest rates. Intermediate Bonds (2-10 Years): Allow investors to lock in higher rates.
Both types of bonds focus on quality and capturing higher yields when faced with challenging market conditions.
Finding the Upside
Much of the volatility seen in the banking sector was due to banks buying bonds during the pandemic—or even earlier—at a time when interest rates were historically low. Since then, rates have climbed considerably. Should rates moderate or stop increasing, this may present better market conditions for bonds. In this way, today’s steep discount in bond markets may present an attractive opportunity for price appreciation. At the same time, investors can potentially lock in strong yields as inflation may subside in the coming years ahead. Learn more about bond investing strategies with New York Life Investments.