Regardless of whether you are opening a lemonade stand or you’re a leading executive at a Fortune 500 company, risk is an inevitable part of the game. Taking bigger risks can generate proportional rewards – and sometimes, such as for the companies you’ll read about below, the risk-taking backfired to queue up some of the biggest bankruptcies in U.S. history.
Going For Broke
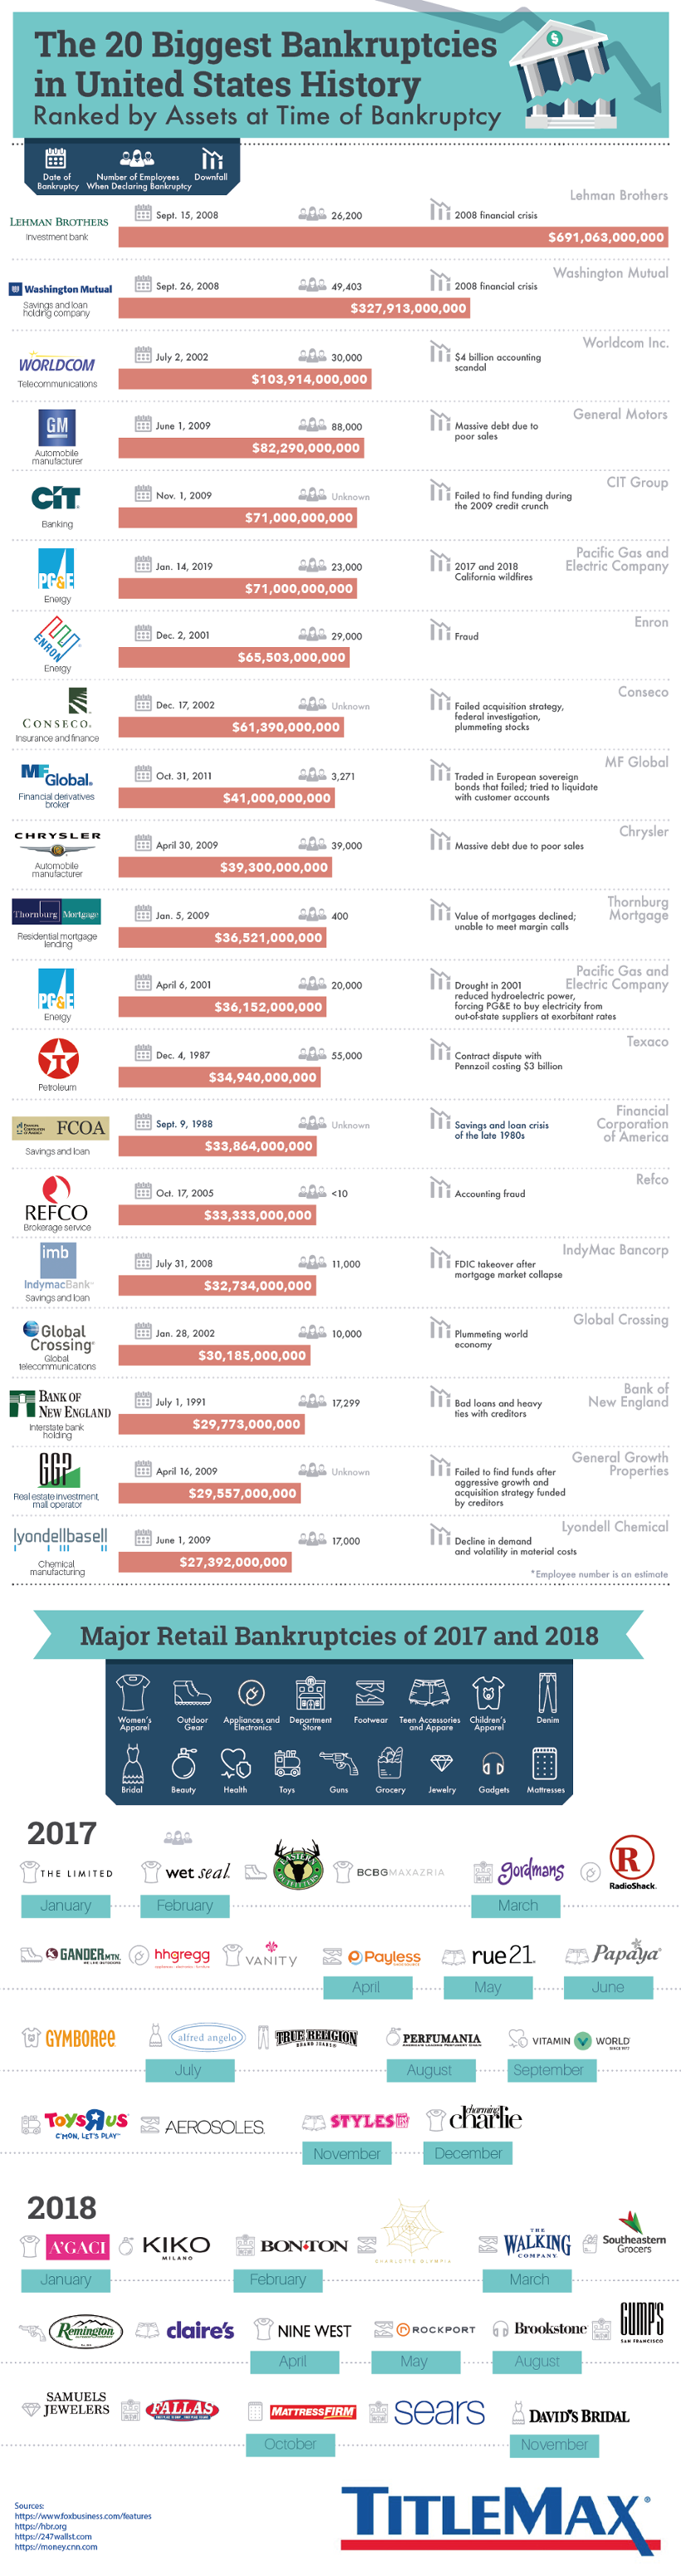
Today’s infographic comes to us from TitleMax, and it highlights the 20 biggest bankruptcies in the country’s history. Companies below are sorted by total assets at the time of bankruptcy.
There are times when companies are forced to push in all of their chips to make a game-changing bet. Sometimes this pans out, and sometimes the plan fails miserably. In other situations, companies were actually unaware they were “all-in”. Instead, the potentially destructive nature of the risk was not even on the radar, only to be later triggered through a global crisis or unanticipated “Black Swan” events.
The Biggest Bankruptcies in the U.S.
Here are the 20 biggest bankruptcies in U.S. history, and what triggered them: The data set on the biggest bankruptcies is organized by assets at time of bankruptcy. Therefore, they are not in inflation-adjusted terms, meaning the list skews towards more recent events. This makes the impact of the 2008 financial crisis particularly easy to spot. The events and consequences relating to the crisis (loan defaults, illiquidity, and declining asset values) were enough to take down banks like Lehman Brothers and WaMu. The after effects – including a slumping global economy – led to a second wave of bankruptcies for companies such as GM and Chrysler. In total, nine of the 20 biggest bankruptcies on the list occurred in the 2008-2009 span.
A Dubious Distinction
You may also notice that one company was on the list twice, and this was not an accident. Pacific Gas & Electric, a California company that is the nation’s largest utility provider, has the dubious distinction of going bankrupt twice in the last 20 years. The first time, in 2001, resulted from a drought that limited hydro electricity generation, forcing the company to import electricity from outside sources at exorbitant prices. The more recent instance happened earlier this year. Facing tens of billions of dollars in liabilities from raging wildfires in California, the utility filed for Chapter 11 protection yet another time. on Last year, stock and bond returns tumbled after the Federal Reserve hiked interest rates at the fastest speed in 40 years. It was the first time in decades that both asset classes posted negative annual investment returns in tandem. Over four decades, this has happened 2.4% of the time across any 12-month rolling period. To look at how various stock and bond asset allocations have performed over history—and their broader correlations—the above graphic charts their best, worst, and average returns, using data from Vanguard.
How Has Asset Allocation Impacted Returns?
Based on data between 1926 and 2019, the table below looks at the spectrum of market returns of different asset allocations:
We can see that a portfolio made entirely of stocks returned 10.3% on average, the highest across all asset allocations. Of course, this came with wider return variance, hitting an annual low of -43% and a high of 54%.
A traditional 60/40 portfolio—which has lost its luster in recent years as low interest rates have led to lower bond returns—saw an average historical return of 8.8%. As interest rates have climbed in recent years, this may widen its appeal once again as bond returns may rise.
Meanwhile, a 100% bond portfolio averaged 5.3% in annual returns over the period. Bonds typically serve as a hedge against portfolio losses thanks to their typically negative historical correlation to stocks.
A Closer Look at Historical Correlations
To understand how 2022 was an outlier in terms of asset correlations we can look at the graphic below:
The last time stocks and bonds moved together in a negative direction was in 1969. At the time, inflation was accelerating and the Fed was hiking interest rates to cool rising costs. In fact, historically, when inflation surges, stocks and bonds have often moved in similar directions. Underscoring this divergence is real interest rate volatility. When real interest rates are a driving force in the market, as we have seen in the last year, it hurts both stock and bond returns. This is because higher interest rates can reduce the future cash flows of these investments. Adding another layer is the level of risk appetite among investors. When the economic outlook is uncertain and interest rate volatility is high, investors are more likely to take risk off their portfolios and demand higher returns for taking on higher risk. This can push down equity and bond prices. On the other hand, if the economic outlook is positive, investors may be willing to take on more risk, in turn potentially boosting equity prices.
Current Investment Returns in Context
Today, financial markets are seeing sharp swings as the ripple effects of higher interest rates are sinking in. For investors, historical data provides insight on long-term asset allocation trends. Over the last century, cycles of high interest rates have come and gone. Both equity and bond investment returns have been resilient for investors who stay the course.