In 2020, we saw the quickest and deepest bear market decline in history, trillions of dollars of global stimulus, the highest volatility (VIX) on record, negative oil prices, and the fastest recovery from a bear market ever—just to name a few of the abnormalities. And while the broader economy is still in a state of repair, investors finished the year in the black. The S&P 500, for example, ended with 16.3% gains, which was an above-average outing for the benchmark index.
Winners and Losing Sectors of 2020
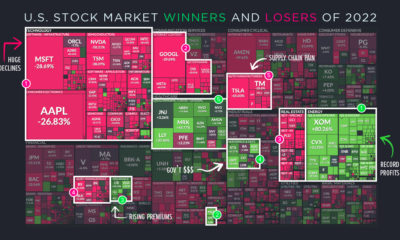
Today’s visualization uses an augmented screenshot of the FinViz treemap, showing the final numbers posted for major U.S.-listed companies, sorted by sector and industry. As you can see, the best and worst performing sectors generally fall into two categories: those that benefitted from COVID-19, and those that didn’t. This massive divergence is evident in the numbers. Companies in winning sectors are often up double or triple digits—while their losing counterparts were often down double digits, sometimes even halving in value from how they started the year.
The Winners
- Software Applications It was another banner year for Big Tech, but some of the top performing companies were those that acted as enablers to remote working and ecommerce. Perhaps the most notable entry here is Shopify, which rose 178% on the year and is nearly a $150 billion company today.
- Basic Materials It’s been a long downtrend in the commodity super cycle, but materials have come back into vogue. Copper prices are at eight-year highs, and gold hit all-time highs in August 2020. Some companies, such as Albemarle—the largest supplier of lithium for electric vehicles—doubled their stock price over the course of the year.
- Freight and Logistics The shift to ecommerce has come faster than anticipated, and companies like FedEx and UPS couldn’t be happier. And with the transportation of ultra-refrigerated vaccines lining up to be a key need of 2021, it’s no surprise to see Cryoport up 165% on the year.
- Semiconductors For a second straight year, semiconductor companies finished as winners on our list. The world needs more hardware to house and process the ever-expanding datasphere, and companies like Nvidia showed triple-digit gains in 2020, up 117%. Honorable mentions: Discount stores, retail home improvement, farm and heavy construction machinery, medical care facilities, and consumer electronics
The Losers
- Oil and Gas The oil sector was already struggling pre-COVID with price wars and a supply glut, but then lockdowns and the shutdown of non-essential travel provided another blow. BP finished the year at nearly half its market capitalization, falling 46% on the year.
- Diversified Banks With record-low interest rates, shuttered physical locations, and credit risks looming from unemployed borrowers, bank stocks struggled in 2020. Wells Fargo, for example, finished down the year 44%.
- Real Estate – Retail Many malls have not been collecting rent checks from their tenants, creating a challenging environment for many property owners and managers. Simon, the country’s largest shopping mall operator, felt the pain as its stock dropped 41% in 2020.
- Airlines It goes without saying that less flying means less revenue for airlines. But going forward, with web conferencing now the professional norm, it’s also expected that lucrative business passenger numbers will take a hit in the future. United Airlines finished the year at less than half their market capitalization (-54%).
- Aerospace/Defense Many aerospace and defense stocks were unable to rebound to pre-pandemic levels. Boeing, for example, finished the year down 36%. on Last year, stock and bond returns tumbled after the Federal Reserve hiked interest rates at the fastest speed in 40 years. It was the first time in decades that both asset classes posted negative annual investment returns in tandem. Over four decades, this has happened 2.4% of the time across any 12-month rolling period. To look at how various stock and bond asset allocations have performed over history—and their broader correlations—the above graphic charts their best, worst, and average returns, using data from Vanguard.
How Has Asset Allocation Impacted Returns?
Based on data between 1926 and 2019, the table below looks at the spectrum of market returns of different asset allocations:
We can see that a portfolio made entirely of stocks returned 10.3% on average, the highest across all asset allocations. Of course, this came with wider return variance, hitting an annual low of -43% and a high of 54%.
A traditional 60/40 portfolio—which has lost its luster in recent years as low interest rates have led to lower bond returns—saw an average historical return of 8.8%. As interest rates have climbed in recent years, this may widen its appeal once again as bond returns may rise.
Meanwhile, a 100% bond portfolio averaged 5.3% in annual returns over the period. Bonds typically serve as a hedge against portfolio losses thanks to their typically negative historical correlation to stocks.
A Closer Look at Historical Correlations
To understand how 2022 was an outlier in terms of asset correlations we can look at the graphic below:
The last time stocks and bonds moved together in a negative direction was in 1969. At the time, inflation was accelerating and the Fed was hiking interest rates to cool rising costs. In fact, historically, when inflation surges, stocks and bonds have often moved in similar directions. Underscoring this divergence is real interest rate volatility. When real interest rates are a driving force in the market, as we have seen in the last year, it hurts both stock and bond returns. This is because higher interest rates can reduce the future cash flows of these investments. Adding another layer is the level of risk appetite among investors. When the economic outlook is uncertain and interest rate volatility is high, investors are more likely to take risk off their portfolios and demand higher returns for taking on higher risk. This can push down equity and bond prices. On the other hand, if the economic outlook is positive, investors may be willing to take on more risk, in turn potentially boosting equity prices.
Current Investment Returns in Context
Today, financial markets are seeing sharp swings as the ripple effects of higher interest rates are sinking in. For investors, historical data provides insight on long-term asset allocation trends. Over the last century, cycles of high interest rates have come and gone. Both equity and bond investment returns have been resilient for investors who stay the course.


