The value of money is not static. In the short term, it may ebb and flow against other currencies on the market. In the long-term, a currency tends to lose buying power over time through inflation, and as more currency units are created. Inflation is a result of too much money chasing too few goods – and it is often influenced by government policies, central banks, and other factors. In this short timeline of monetary history in the 20th century, we look at major events, the change in money supply, and the buying power of the U.S. dollar in each decade.
A Short Timeline of U.S. Monetary History
1900s After the Panic of 1907, the National Monetary Commission is established to propose legislation to regulate banking.
U.S. Money Supply: $7 billion What $1 Could Buy: A pair of patent leather shoes.
1910s The Federal Reserve Act is signed in 1913 by President Woodrow Wilson.
U.S. Money Supply: $13 billion What $1 Could Buy: A woman’s house dress.
1920s U.S. dollar bills were reduced in size by 25%, and standardized in terms of design.
The Fed starts using open market operations as a tool for monetary policy.
U.S. Money Supply: $35 billion What $1 Could Buy: Five pounds of sugar.
1930s To deal with deflation during the Great Depression, the United States suspends the gold standard. President Franklin D. Roosevelt signs Executive Order 6102, which criminalizes the possession of gold.
By no longer allowing gold to be legally redeemed, this removes a major constraint on the Fed, which can now control the money supply.
U.S. Money Supply: $46 billion What $1 Could Buy: 16 cans of Campbell’s Soup
1940s The massive deficits of World War II are almost financed entirely by the creation of new money by the Federal Reserve.
Interest rates are pegged low at the request of the Treasury.
Under Bretton-Woods, the “gold-exchange standard” is adopted.
U.S. Money Supply: $55 billion What $1 Could Buy: 20 bottles of Coca-Cola
1950s The Korean War starts in 1950, and inflation is at an annualized rate of 21%.
The Fed can no longer manage such low interest rates, and tells the Treasury that it can “no longer maintain the existing situation”.
U.S. Money Supply: $151 billion What $1 Could Buy: One Mr. Potato Head
1960s An agreement, called the Treasury-Federal Reserve Accord, is reached to establish the central bank’s independence.
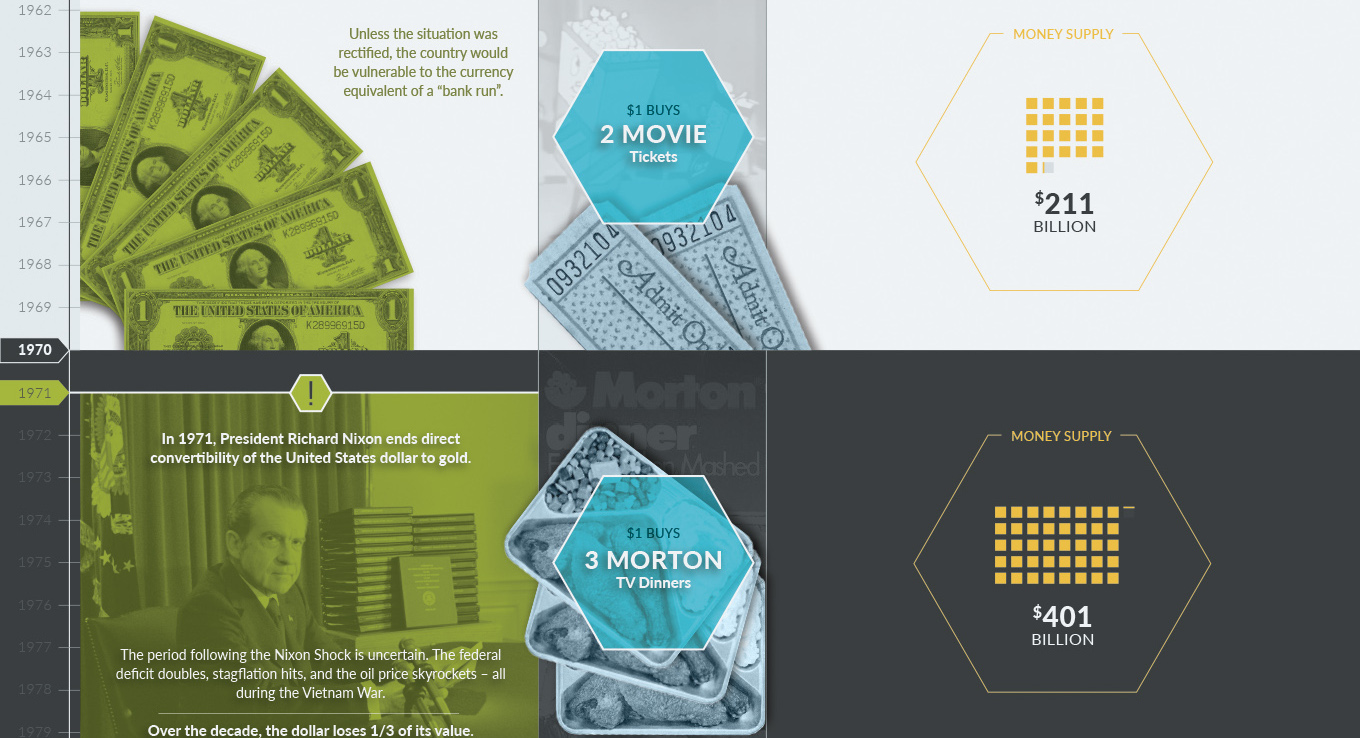
By this time, U.S. dollars in circulation around the world exceeded U.S. gold reserves. Unless the situation was rectified, the country would be vulnerable to the currency equivalent of a “bank run”.
U.S. Money Supply: $211 billion What $1 Could Buy: Two movie tickets.
1970s In 1971, President Richard Nixon ends direct convertibility of the United States dollar to gold.
The period following the Nixon Shock is uncertain. The federal deficit doubles, stagflation hits, and the oil price skyrockets – all during the Vietnam War.
Over the decade, the dollar loses 1/3 of its value.
U.S. Money Supply: $401 billion What $1 Could Buy: Three Morton TV dinners.
1980s The stock market crashes in 1987 on Black Monday.
The Federal Reserve, under newly-appointed Alan Greenspan, issues the following statement:
“The Federal Reserve, consistent with its responsibilities as the nation’s central bank, affirmed today its readiness to serve as a source of liquidity to support the economic and financial system.”
The Dow would recover by 1989, with no prolonged recession occurring.
U.S. Money Supply: $1,560 billion What $1 Could Buy: One bottle of Heinz Ketchup.
1990s This decade is generally considered to be a time of declining inflation and the longest peacetime economic expansion in U.S. history.
During this decade, many improvements are made to U.S. paper currency to prevent counterfeiting. Microprinting, security thread, and other features are used.
U.S. Money Supply: $3,277 billion What $1 Could Buy: One gallon of milk.
2000s After the Dotcom crash, the Fed drops interest rates to near all-time lows.
In 2008, the Financial Crisis hits and the Fed begins “quantitative easing”. Later, this would be known as QE1.
U.S. Money Supply: $4,917 billion What $1 Could Buy: One Wendy’s hamburger.
2010- After QE1, the Fed holds $2.1 trillion of bank debt, mortgage-backed securities, and Treasury notes. Shortly after, QE2 starts.
In 2012, it’s time for QE3.
Purchases were halted in October 2014 after accumulating $4.5 trillion in assets.
U.S. Money Supply: $13,291 billion What $1 Could Buy: One song from iTunes.
The Changing Value of a Dollar
At the turn of the 20th century, the money supply was just $7 billion. Today there are literally 1,900X more dollars in existence. While economic growth has meant we all make many more dollars today, it is still phenomenal to think that during past moments in the 20th century, a dollar could buy a pair of leather shoes or a women’s house dress. The buying power of a dollar has changed significantly over the last century, but it’s important to recognize that it could change even faster (up or down) under the right economic circumstances.
About The Money Project
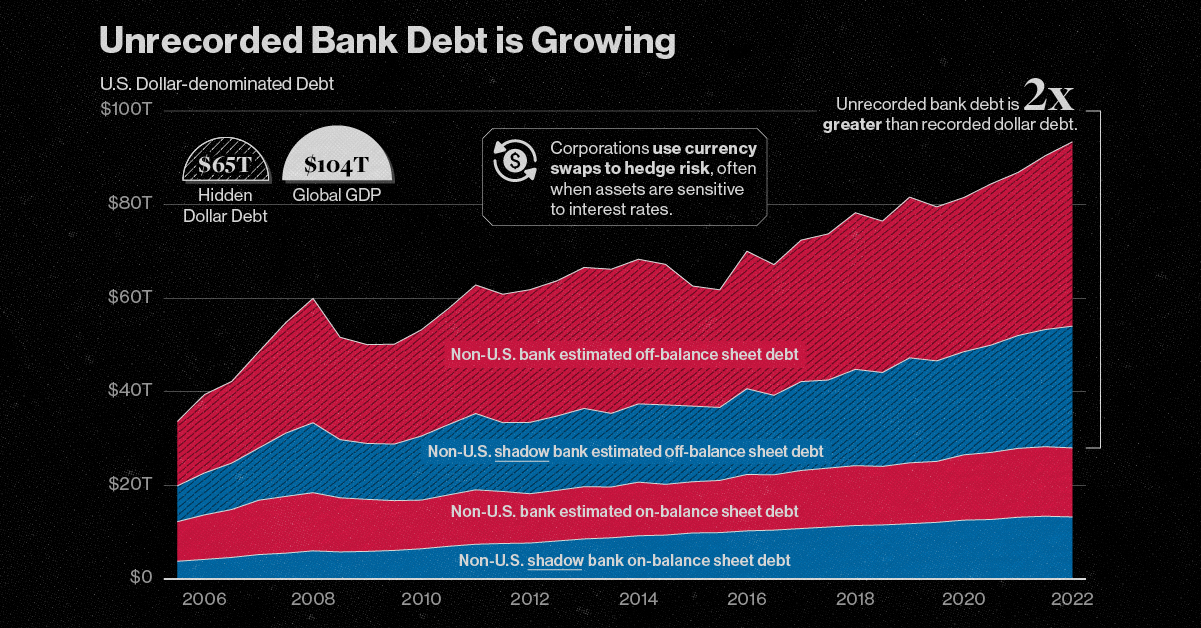
The Money Project is an ongoing collaboration between Visual Capitalist and Texas Precious Metals that seeks to use intuitive visualizations to explore the origins, nature, and use of money. on The scale of hidden dollar debt around the world is huge. No less than $65 trillion in unrecorded dollar debt circulates across the global financial system in non-U.S. banks and shadow banks. To put in perspective, global GDP sits at $104 trillion. This dollar debt is in the form of foreign-exchange swaps, which have exploded over the last decade due to years of monetary easing and ultra-low interest rates, as investors searched for higher yields. Today, unrecorded debt from these foreign-exchange swaps is worth more than double the dollar debt officially recorded on balance sheets across these institutions. Based on analysis from the Bank of International Settlements (BIS), the above infographic charts the rise in hidden dollar debt across non-U.S. financial institutions and examines the wider implications of its growth.
Dollar Debt: A Beginners Guide
To start, we will briefly look at the role of foreign-exchange (forex) swaps in the global economy. The forex market is the largest in the world by a long stretch, with trillions traded daily. Some of the key players that use foreign-exchange swaps are:
Corporations Financial institutions Central banks
To understand forex swaps is to look at the role of currency risk. As we have seen in 2022, the U.S. dollar has been on a tear. When this happens, it hurts company earnings that generate revenue across borders. That’s because they earn revenue in foreign currencies (which have likely declined in value against the dollar) but end up converting earnings to U.S. dollars. In order to reduce currency risk, market participants will buy forex swaps. Here, two parties agree to exchange one currency for another. In short, this helps protect the company from unfavorable foreign exchange rates. What’s more, due to accounting rules, forex swaps are often unrecorded on balance sheets, and as a result are quite opaque.
A Mountain of Debt
Since 2008, the value of this opaque, unrecorded dollar debt has nearly doubled.
*As of June 30, 2022
Driving its rise in part was an era of rock-bottom interest rates globally. As investors sought out higher returns, they took on greater leverage—and forex swaps are one example of this.
Now, as interest rates have been rising, forex swaps have increased amid higher market volatility as investors look to hedge currency risk. This appears in both non-U.S. banks and non-U.S. shadow banks, which are unregulated financial intermediaries.
Overall, the value of unrecorded debt is staggering. An estimated $39 trillion is held by non-U.S. banks along with $26 trillion in overseas shadow banks around the world.
Past Case Studies
Why does the massive growth in dollar debt present risks? During the market crashes of 2008 and 2020, forex swaps faced a funding squeeze. To borrow U.S. dollars, market participants had to pay high rates. A lot of this hinged on the impact of extreme volatility on these swaps, putting pressure on funding rates. Here are two examples of how volatility can heighten risk in the forex market:
Exchange-rate volatility: Sharp swings in USD can spur a liquidity crunch U.S. interest-rate volatility: Sudden rate fluctuations can mean much higher costs for these trades
In both cases, the U.S. central bank had to step in to provide liquidity in the market and prevent dollar shortages. This was done through pumping cash into the system and creating swap lines with other non-U.S. banks such as the Bank of Canada or the Bank of Japan. These were designed to protect from declining currency values and a liquidity crunch.
Dollar Debt: The Wider Implications
The risk from growing dollar debt and these swap lines arises when a non-U.S. bank or shadow bank may not be able to hold up their end of the agreement. In fact, on a daily basis, there is an estimated $2.2 trillion in forex swaps exposed to settlement risk. Given its vast scale, this dollar debt could have greater systemic spillover effects. If participants fail to pay it could undermine financial market stability. Because demand for U.S. dollars increases during market uncertainty, a worsening economic climate could potentially expose the forex market to more vulnerabilities.