Today’s infographic from New York Life Investments highlights the level of disrepair in U.S. infrastructure. It also explores why taxable municipal bonds, which will finance the required infrastructure upgrades, provide such an interesting investment opportunity.
Falling Apart at the Seams
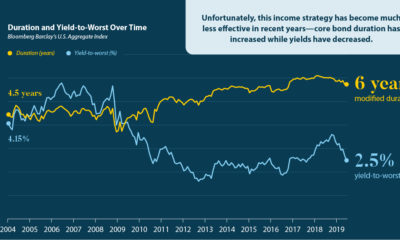
The American Society of Civil Engineers (ACSE) regularly assesses the nation’s infrastructure—things like bridges, airports, and drinking water—and scores it in a ‘report card’. After decades of neglect, the U.S. only scored a D+ in 2017. The ASCE estimates that $4 trillion is needed to bring infrastructure up to a B grade, $1.3 trillion of which will be provided by state and local governments. — Ed Mortimer, U.S. Chamber Vice President of Transportation and Infrastructure U.S. municipal bonds will be the primary funding source for this massive financing need. These bonds are quite popular with individual U.S. investors, as the interest income from most municipal bonds is not subject to federal income tax. However, the U.S. tax code limits the volume of non-taxable bonds issued, and the purposes for issuing them. As a result, many local and state governments have been turning to taxable municipal bonds to finance their infrastructure projects.
The Muni Opportunity
Taxable municipal bonds are a potentially attractive investment for many reasons.
- Competitive Historical Yield and Strong Returns In the last decade, a lagging global economy led to historically low interest rates—many sovereign (national) bonds fell into negative territory. Taxable municipal bonds provided an alternative source of yield potential, outpacing the yields of comparable treasury bonds in some cases. Not only that, but in the post-crisis era, taxable municipal bonds have averaged a return of 6.9% per year, beating the 4.6% performance on U.S. corporate investment-grade bonds, a staple in most institutional portfolios.
- High-Quality, Stable Credit Ratings Most municipal bonds are high quality with low default rates, making them attractive to risk-conscious investors. Historically, municipal bond ratings have also been far more stable than that of global corporates.
- Inefficient pricing The municipal bond market is highly fragmented, and most issues are too small to be included in a market index. This market fragmentation, combined with limited sell-side research and many buy-and-hold investors, often leads to inefficient pricing. Active investors have the potential to generate higher returns by applying their credit research and trading skills.
- Low Correlations Correlation measures the degree to which two securities move in relation to each other. In general, taxable municipal bonds have a low correlation to other fixed-income sectors. This means they help provide portfolio diversification and reduce volatility.
- Longer durations Since taxable municipal bonds fund long-term capital projects, they are usually financed with longer maturing bonds. Institutional investors welcome this source of long-duration assets, as they can match them up with their long-dated obligations.
A Compelling Portfolio Addition
Taxable municipal bonds have many positive qualities that make them a strong contender for investment. When added to a diversified fixed-income portfolio, they may also improve the risk/return profile. As the U.S. begins to revitalize its infrastructure, taxable municipal bonds present a strong—and often overlooked—opportunity for investors. on Last year, stock and bond returns tumbled after the Federal Reserve hiked interest rates at the fastest speed in 40 years. It was the first time in decades that both asset classes posted negative annual investment returns in tandem. Over four decades, this has happened 2.4% of the time across any 12-month rolling period. To look at how various stock and bond asset allocations have performed over history—and their broader correlations—the above graphic charts their best, worst, and average returns, using data from Vanguard.
How Has Asset Allocation Impacted Returns?
Based on data between 1926 and 2019, the table below looks at the spectrum of market returns of different asset allocations:
We can see that a portfolio made entirely of stocks returned 10.3% on average, the highest across all asset allocations. Of course, this came with wider return variance, hitting an annual low of -43% and a high of 54%.
A traditional 60/40 portfolio—which has lost its luster in recent years as low interest rates have led to lower bond returns—saw an average historical return of 8.8%. As interest rates have climbed in recent years, this may widen its appeal once again as bond returns may rise.
Meanwhile, a 100% bond portfolio averaged 5.3% in annual returns over the period. Bonds typically serve as a hedge against portfolio losses thanks to their typically negative historical correlation to stocks.
A Closer Look at Historical Correlations
To understand how 2022 was an outlier in terms of asset correlations we can look at the graphic below:
The last time stocks and bonds moved together in a negative direction was in 1969. At the time, inflation was accelerating and the Fed was hiking interest rates to cool rising costs. In fact, historically, when inflation surges, stocks and bonds have often moved in similar directions. Underscoring this divergence is real interest rate volatility. When real interest rates are a driving force in the market, as we have seen in the last year, it hurts both stock and bond returns. This is because higher interest rates can reduce the future cash flows of these investments. Adding another layer is the level of risk appetite among investors. When the economic outlook is uncertain and interest rate volatility is high, investors are more likely to take risk off their portfolios and demand higher returns for taking on higher risk. This can push down equity and bond prices. On the other hand, if the economic outlook is positive, investors may be willing to take on more risk, in turn potentially boosting equity prices.
Current Investment Returns in Context
Today, financial markets are seeing sharp swings as the ripple effects of higher interest rates are sinking in. For investors, historical data provides insight on long-term asset allocation trends. Over the last century, cycles of high interest rates have come and gone. Both equity and bond investment returns have been resilient for investors who stay the course.