Water is the world’s most vital resource. Beyond its basic functions of sustaining life, it’s also a precious commodity – one that billions of people in the world have trouble accessing. Today’s infographic is from Raconteur, and it puts the global issue of water access into staggering perspective. It’s a two-fold problem: safe drinking water is hard to come by, while basic access to sanitation is less common than you’d expect.
Diving into Drinking Water
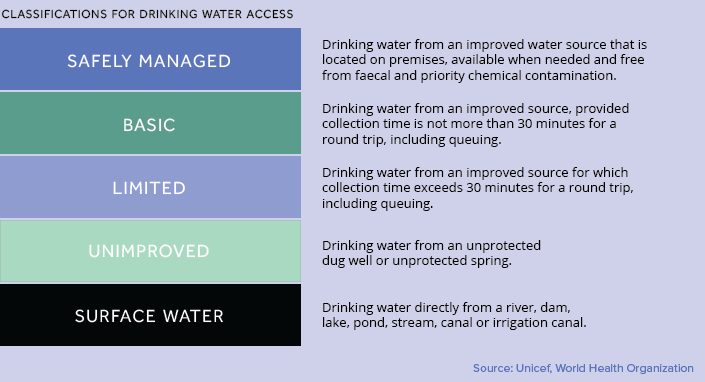
It’s easy to take water for granted when it comes out of every tap in developed economies, but the stark reality is that 2.1 billion people worldwide can’t get safe water this way. Many people in the world spend hours waiting in long lines, often multiple times a day, for community-shared water, or, they have to travel to distant sources just to collect it. World regions are categorized according to five classifications for drinking water access.
Here’s a breakdown of how each region fares. The water crisis in Flint, Michigan is a dire exception to the safely managed water rule in North America. After a change in river source in 2014, insufficient water treatment resulted in lead from pipes leaching into the drinking water, affecting over 100,000 residents.
The Struggle of Sanitation
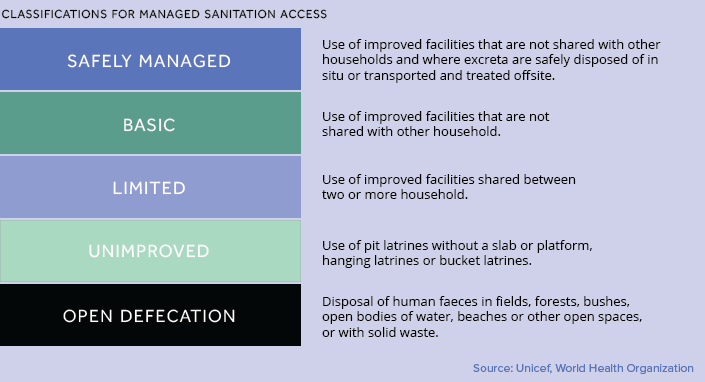
The invention of the toilet in 1875 is credited with saving one billion lives to date. Yet, poor water hygiene and its associated diseases claim the lives of roughly one million people annually. This is because roughly 4.5 billion people still don’t have access to a toilet, with the problem being particularly acute on the African continent. More than half of the population in Eritrea (76%), Niger (71%), Chad (68%) and South Sudan (61%), for example, do not have any access to even basic sanitation.
Every Drop of Water Counts
According to the World Economic Forum, water has been a top-five global risk for the past seven years. From an economic perspective, it’s easy to see why:
An estimated $260 billion is lost globally each year from the lack of basic water and sanitation. Almost $18.5 billion in benefits can come from universal access to basic water and sanitation.
Securing water access has profound consequences. For every $1 invested in water and sanitation, there’s a $4 return from lower health costs, higher productivity, and fewer preventable deaths. Fortunately, progress is being made on the global scale. Between 2001 and 2015, there’s been a 9% improvement in safe drinking water, while safely managed sanitation has risen by 10%. on In fact, many pieces of ocean plastic waste have come together to create a vortex of plastic waste thrice the size of France in the Pacific Ocean between California and Hawaii. Where does all of this plastic come from? In this graphic, Louis Lugas Wicaksono used data from a research paper by Lourens J.J. Meijer and team to highlight the top 10 countries emitting plastic pollutants in the waters surrounding them.
Plastic’s Ocean Voyage
First, let’s talk about how this plastic waste reaches the oceans in the first place. Most of the plastic waste found in the deep blue waters comes from the litter in parks, beaches, or along the storm drains lining our streets. These bits of plastic waste are carried into our drains, streams, and rivers by wind and rainwater runoff. The rivers then turn into plastic superhighways, transporting the plastic to the oceans. A large additional chunk of ocean plastic comes from damaged fishing nets or ghost nets that are directly discarded into the high seas.
Countries Feeding the Plastic Problem
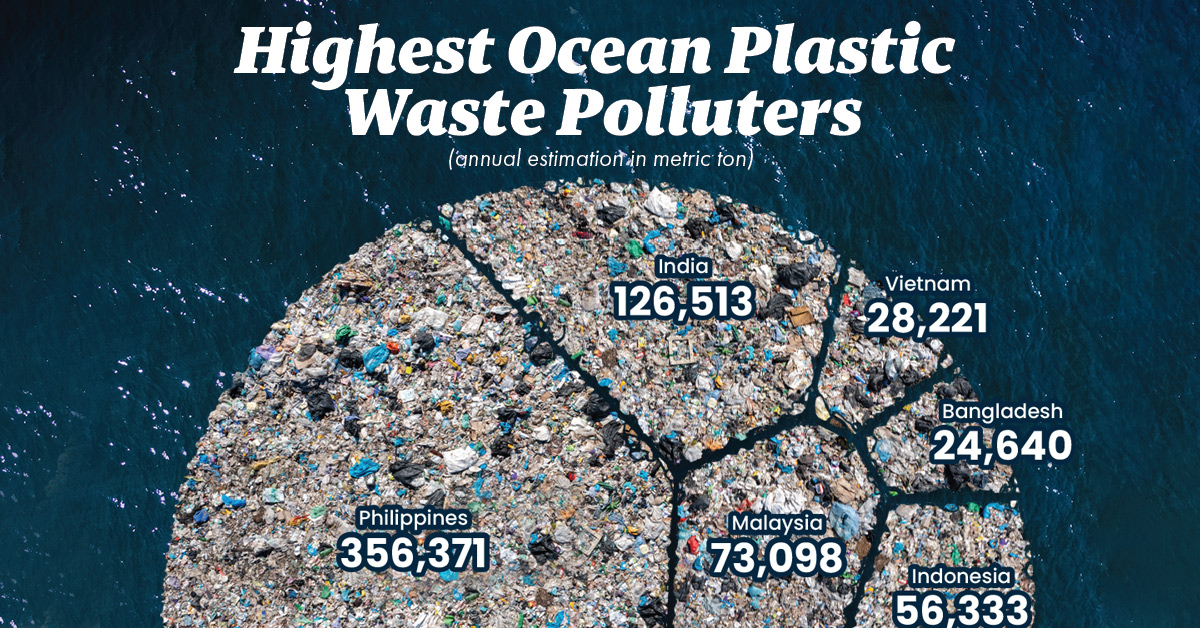
Some might think that the countries producing or consuming the most plastic are the ones that pollute the oceans the most. But that’s not true. According to the study, countries with a smaller geographical area, longer coastlines, high rainfall, and poor waste management systems are more likely to wash plastics into the sea. For example, China generates 10 times the plastic waste that Malaysia does. However, 9% of Malaysia’s total plastic waste is estimated to reach the ocean, in comparison to China’s 0.6%. The Philippines—an archipelago of over 7,000 islands, with a 36,289 kilometer coastline and 4,820 plastic emitting rivers—is estimated to emit 35% of the ocean’s plastic. In addition to the Philippines, over 75% of the accumulated plastic in the ocean is reported to come from the mismanaged waste in Asian countries including India, Malaysia, China, Indonesia, Myanmar, Vietnam, Bangladesh, and Thailand.
The Path to a Plastic-free Ocean
The first, and most obvious, way to reduce plastic accumulation is to reduce the use of plastic. Lesser production equals lesser waste. The second step is managing the plastic waste generated, and this is where the challenge lies. Many high-income countries generate high amounts of plastic waste, but are either better at processing it or exporting it to other countries. Meanwhile, many of the middle-income and low-income countries that both demand plastics and receive bulk exports have yet to develop the infrastructure needed to process it.