Which parts of the world are perceived to be most corrupt – and further, how does this data differ between regions, and how has it trended over time?
The Corruption Perception Index (CPI)
Today’s chart pulls its numbers from the recent 2018 Corruption Perceptions Index report, which has been published by Transparency International annually since 1995. The report scores 180 countries, and is considered the world’s most widely-used barometer for corruption. However, before we dive in to the data, it’s worth taking a quick look at the methodology behind the report: Methodology:
The CPI attempts to measure perceptions about corruption in a country, rather than corruption itself Specifically, it is focused on the public sector of countries, which includes governments and government-run institutions The CPI is a composite index, using the results from 13 separate reports and surveys to calculate an overall score Scores range from 0 (most corrupt) to 100 (most clean)
Finally, it’s also worth noting that in the chart, we’ve added in government types as rated by the Economist Intelligence Unit – they range from “Full Democracy” to “Autocratic Regime”.
The Most and Least Corrupt Places
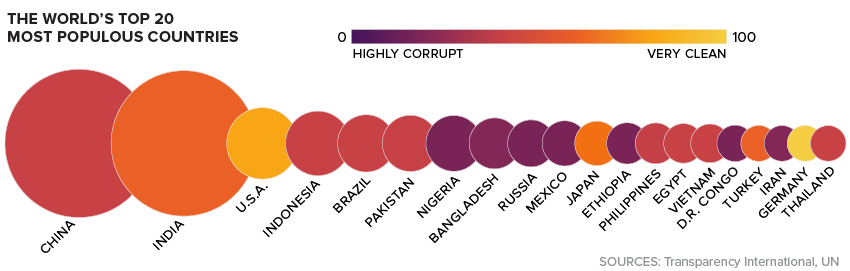
What do experts and businesspeople see as the most and least corrupt global regions? Western Europe has the highest score on average, while Sub-Saharan Africa has the lowest (most corrupt) average score. The Americas ranks just above the global average score of 43, mainly because the average is skewed by the lower scores of many countries in Latin America (such as Venezuela) and the Caribbean (such as Haiti). Now, let’s look at the top 10 countries overall: Here’s also a look at the world’s 20 most populous countries:
As the report notes, the relation between democracy and corruption appears to be quite clear: the more democratic a regime is, the less corrupt it is perceived to be. Using the Economist Intelligence Unit rankings, there are no “Hybrid” or “Autocratic” regimes that come anywhere near the top 10. The closest may be the U.A.E. – which is classified as an Autocratic Regime – which has a CPI score of 70, good for 23rd place globally.
Trends Over Time
Over the last seven years, the report notes that there were a few specific countries that have consistently trended in one direction or another. Hungary: The country has seen a -9 point change to its CPI score since 2012, dropping to 46 points in total. That’s just a notch above the global average. Turkey: Turkey’s rating has deteriorated from 49 to 41 over the 2012-2018 time period. Argentina: The South American nation has seen its score rise by eight points over the 2012-2018 time period. Guyana: Guyana has gained nine points – a significant improvement over its original score of 28 at the start of that time period. What will be the next country to jump up (or down) the list – and what factors will lead to this change in perception? Note: The color-coding on the map has been updated to better reflect CPI scores. Ukraine was incorrectly classified as an Autocratic Regime. on Last year, stock and bond returns tumbled after the Federal Reserve hiked interest rates at the fastest speed in 40 years. It was the first time in decades that both asset classes posted negative annual investment returns in tandem. Over four decades, this has happened 2.4% of the time across any 12-month rolling period. To look at how various stock and bond asset allocations have performed over history—and their broader correlations—the above graphic charts their best, worst, and average returns, using data from Vanguard.
How Has Asset Allocation Impacted Returns?
Based on data between 1926 and 2019, the table below looks at the spectrum of market returns of different asset allocations:
We can see that a portfolio made entirely of stocks returned 10.3% on average, the highest across all asset allocations. Of course, this came with wider return variance, hitting an annual low of -43% and a high of 54%.
A traditional 60/40 portfolio—which has lost its luster in recent years as low interest rates have led to lower bond returns—saw an average historical return of 8.8%. As interest rates have climbed in recent years, this may widen its appeal once again as bond returns may rise.
Meanwhile, a 100% bond portfolio averaged 5.3% in annual returns over the period. Bonds typically serve as a hedge against portfolio losses thanks to their typically negative historical correlation to stocks.
A Closer Look at Historical Correlations
To understand how 2022 was an outlier in terms of asset correlations we can look at the graphic below:
The last time stocks and bonds moved together in a negative direction was in 1969. At the time, inflation was accelerating and the Fed was hiking interest rates to cool rising costs. In fact, historically, when inflation surges, stocks and bonds have often moved in similar directions. Underscoring this divergence is real interest rate volatility. When real interest rates are a driving force in the market, as we have seen in the last year, it hurts both stock and bond returns. This is because higher interest rates can reduce the future cash flows of these investments. Adding another layer is the level of risk appetite among investors. When the economic outlook is uncertain and interest rate volatility is high, investors are more likely to take risk off their portfolios and demand higher returns for taking on higher risk. This can push down equity and bond prices. On the other hand, if the economic outlook is positive, investors may be willing to take on more risk, in turn potentially boosting equity prices.
Current Investment Returns in Context
Today, financial markets are seeing sharp swings as the ripple effects of higher interest rates are sinking in. For investors, historical data provides insight on long-term asset allocation trends. Over the last century, cycles of high interest rates have come and gone. Both equity and bond investment returns have been resilient for investors who stay the course.