By 2050, there will be two billion people that are 60 years or older globally. Meanwhile, the amount of seniors (65+ years old) in the U.S. will double to 100 million by 2060. To meet the needs of this aging population, we will continue to need larger quantities and more varieties of prescription drug treatments – an industry that is expected to skyrocket to $1.2 trillion in size by 2024.
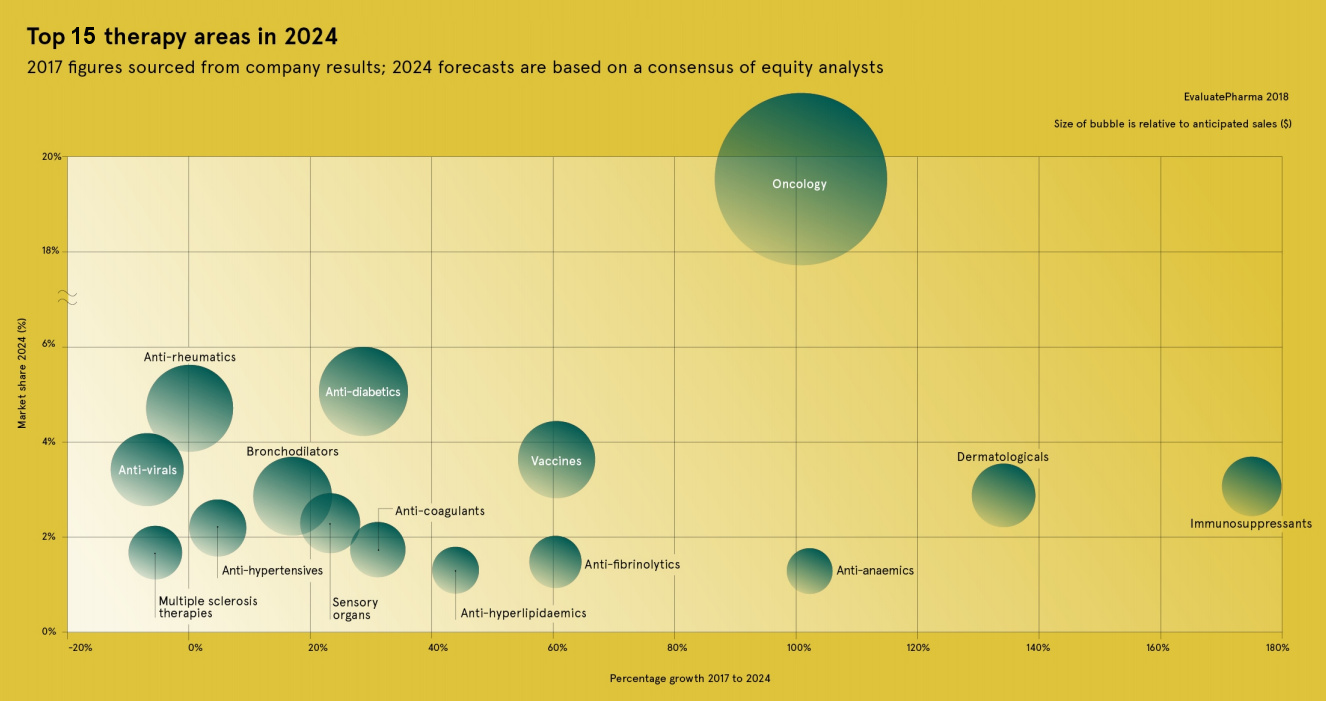
Drug Sales, by Segment
Today’s infographic comes to us from Raconteur, and it highlights the most anticipated drug treatments and therapy areas for the pharmaceutical industry. It starts by breaking down the massive pharma market into therapy segments, showing a forecast for the size and growth for each category. Here is the data for the top 15 segments, sorted by projected worldwide prescription drug sales in 2024: This data, which comes from a recent report from EvaluatePharma, helps showcase a few key insights. Firstly, the oncology therapy area – which makes drugs that are used to treat various forms of cancer – is by far the largest in the pharma world with $107 billion in sales in 2017. It’s also projected to maintain its dominance going forward, growing at an impressive 12.2% CAGR to $233 billion by 2024. Next, while sales in cancer-related drugs will be the most in absolute terms, the fastest growing treatment area is actually in immunosuppressants – a segment of drugs that make a body less likely to reject a transplanted organ, such as a liver, heart, or kidney. It’s projected that this segment will grow at 15.7% per year, eventually becoming the sixth largest pharma segment at $38.1 billion in 2024. Lastly, while sales in the pharma market will be averaging 6.1% in annual growth as a whole, there are two major segments that will see negative annual growth going forward: Anti-virals (-0.9%) and MS Therapies (-0.8%).
The Battle Against Cancer
Currently, there are more drugs used for treating cancer than for any other type of disease or condition. Unfortunately, even though many cancer drugs are available on the market already, the debilitating disease is still a leading cause of death. Existing drugs are used in treatments of chemotherapy or hormone therapy, but it’s clear that there is still plenty of room for progress to be made against the disease. For these reasons – combined with the estimate that nearly 40% of Americans will be diagnosed with some form of cancer during their lifetimes – it’s no surprise to see that companies have yet even more cancer drugs in the pipeline: As more drugs get approved from the above pipeline, it is projected that $1 of every $5 spent on prescription drugs in 2024 will be going towards cancer-related treatments. on These are in the form of Treasury securities, some of the most liquid assets worldwide. Central banks use them for foreign exchange reserves and private investors flock to them during flights to safety thanks to their perceived low default risk. Beyond these reasons, foreign investors may buy Treasuries as a store of value. They are often used as collateral during certain international trade transactions, or countries can use them to help manage exchange rate policy. For example, countries may buy Treasuries to protect their currency’s exchange rate from speculation. In the above graphic, we show the foreign holders of the U.S. national debt using data from the U.S. Department of the Treasury.
Top Foreign Holders of U.S. Debt
With $1.1 trillion in Treasury holdings, Japan is the largest foreign holder of U.S. debt. Japan surpassed China as the top holder in 2019 as China shed over $250 billion, or 30% of its holdings in four years. This bond offloading by China is the one way the country can manage the yuan’s exchange rate. This is because if it sells dollars, it can buy the yuan when the currency falls. At the same time, China doesn’t solely use the dollar to manage its currency—it now uses a basket of currencies. Here are the countries that hold the most U.S. debt: As the above table shows, the United Kingdom is the third highest holder, at over $655 billion in Treasuries. Across Europe, 13 countries are notable holders of these securities, the highest in any region, followed by Asia-Pacific at 11 different holders. A handful of small nations own a surprising amount of U.S. debt. With a population of 70,000, the Cayman Islands own a towering amount of Treasury bonds to the tune of $284 billion. There are more hedge funds domiciled in the Cayman Islands per capita than any other nation worldwide. In fact, the four smallest nations in the visualization above—Cayman Islands, Bermuda, Bahamas, and Luxembourg—have a combined population of just 1.2 million people, but own a staggering $741 billion in Treasuries.
Interest Rates and Treasury Market Dynamics
Over 2022, foreign demand for Treasuries sank 6% as higher interest rates and a strong U.S. dollar made owning these bonds less profitable. This is because rising interest rates on U.S. debt makes the present value of their future income payments lower. Meanwhile, their prices also fall. As the chart below shows, this drop in demand is a sharp reversal from 2018-2020, when demand jumped as interest rates hovered at historic lows. A similar trend took place in the decade after the 2008-09 financial crisis when U.S. debt holdings effectively tripled from $2 to $6 trillion.
Driving this trend was China’s rapid purchase of Treasuries, which ballooned from $100 billion in 2002 to a peak of $1.3 trillion in 2013. As the country’s exports and output expanded, it sold yuan and bought dollars to help alleviate exchange rate pressure on its currency. Fast-forward to today, and global interest-rate uncertainty—which in turn can impact national currency valuations and therefore demand for Treasuries—continues to be a factor impacting the future direction of foreign U.S. debt holdings.