Yet despite this growth, sustainable ETFs—baskets of investments that focus on environmental, social and governance issues—account for roughly 5% of the entire ETF universe. What makes up this rapidly growing market? Where are the most common areas for investment? To answer this question, this infographic from MSCI breaks down the sustainable ETF universe.
Sustainable ETFs: An Overview
By and large, the scope of sustainable ETFs can vary. One sustainable ETF may consist of clean tech companies, and another could focus on sustainable leaders in the S&P 500. Like the broader ETF market, they typically offer low fees.
Overall, the sustainable ETF universe can be broken down into four types of assets.
As of Dec. 31, 2020 Source: MSCI LLC ESG Research (Feb, 2021)
Unsurprisingly, the majority of sustainable ETFs are equity ETFs, comprising 81% of the market as of Dec. 31, 2020.
Following equity ETFs are bond ETFs, at nearly 17% of the total universe. One growing subset, known as green bonds, are typically used to fund environmental projects such as water management and green buildings. Here, debt issuers generate fixed income for investors that target climate objectives.
Meanwhile, there are just eight funds globally, or about 2% of sustainable ETFs, that combine more than one type of asset. Alternative ETFs, which are assets outside of stocks and bonds, are the smallest part of the universe at 0.5%.
Sustainable ETFs by Approach
Next, let’s take a look at different sustainable investing styles. Generally speaking, there are four main approaches: integration, values & screening, thematic, and impact. As of Dec. 31, 2020 Source: MSCI LLC ESG Research (Feb, 2021) Integration approaches, which make up 41% of the universe, are when investors use ESG factors to identify risks and opportunities that may enhance long-term performance. A best-in-class method, which invests in leaders in a given sector, is one form of an ESG integration approach. In the U.S., the 24 largest equity ETFs following this approach hold roughly $25 billion in assets. At the lower end of the spectrum, 3% of all sustainable ETFs follow impact approaches, which cover investments that provide solutions to environmental and social issues. Investments that fall under this approach may have frameworks that target the UN Sustainable Development Goals.
Sustainable ETFs by Domicile
Where are the biggest markets for launching sustainable ETFs?
When it comes to the prevalence of sustainable ETFs around the world, Europe leads the way. With over half of all sustainable ETFs, Europe surpasses North America by a significant margin. Of the 40 ETFs with over $1 billion in assets, 26 are domiciled in Europe.
As of Dec. 31, 2020 Source: MSCI LLC ESG Research (Feb, 2021)
Despite covering about 6% of the total number of ESG ETFs, interest in sustainability investing is strong in Asia. Notably, one study found that 79% of institutional investors in Asia-Pacific “significantly” or “moderately” increased investment in ESG-linked assets.
Understanding the Carbon Intensity of Sustainable ETFs
Finally, let’s examine how the carbon intensity of sustainable ETFs breaks down. Carbon intensity measures the amount of carbon dioxide equivalent emitted relative to a company’s revenue.
As of Dec. 31, 2020 Source: MSCI LLC ESG Research (Feb, 2021)
The carbon intensity of the average company varies significantly across sectors.
Interestingly, under 6% of sustainable ETFs exhibited the lowest carbon intensity levels of 0 to 15 weighted average tons of CO2 equivalent (WACI). Among the lowest carbon-intensive ETFs was one with a greater focus on banking, insurance and financials.
By contrast, sustainable ETFs with the highest carbon intensity levels accounted for over 7% of the total universe, with these funds holding higher shares of mining and utilities companies.
Across all sustainable ETFs, 58% fell within the moderate range of 70 to 250 WACI.
At the Crossroads
Sustainable investing may be one of the most critical movements over the last decade for the financial industry. But at the same time, greenwashing concerns are rising. To offset this trend, the European Union has set in place new rules on what constitutes a sustainable fund. Here, investments will essentially be labeled as sustainable or not. This could become a global standard. For investors who wish to invest in sustainable ETFs, the importance of research and data providers will play a more concrete role, especially as the universe continues to expand. on Over recent decades, farmers have been able to more than double their production of crops thanks to fertilizers and the vital nutrients they contain. When crops are harvested, the essential nutrients are taken away with them to the dining table, resulting in the depletion of these nutrients in the soil. To replenish these nutrients, fertilizers are needed, and the cycle continues. The above infographic by Brazil Potash shows the role that each macronutrient plays in growing healthy, high-yielding crops.
Food for Growth
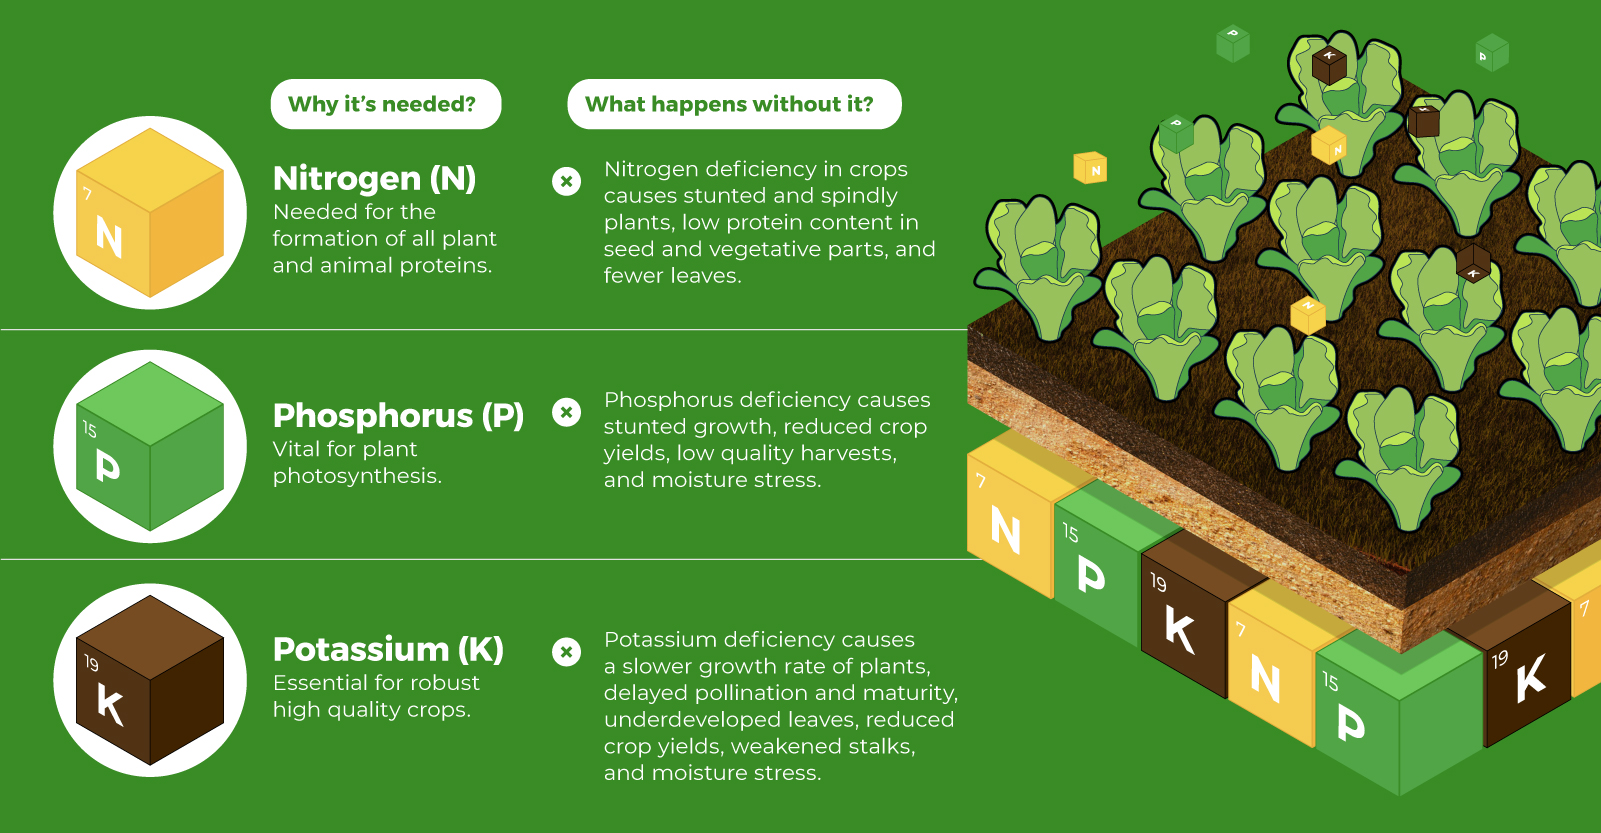
Nitrogen, phosphorus, and potassium (NPK) are three primary macronutrients that are the building blocks of the global fertilizer industry. Each plays a key role in plant nutrition and promoting crop growth with higher yields. Let’s take a look at how each macronutrient affects plant growth. If crops lack NPK macronutrients, they become vulnerable to various stresses caused by weather conditions, pests, and diseases. Therefore, it is crucial to maintain a balance of all three macronutrients for the production of healthy, high-yielding crops.
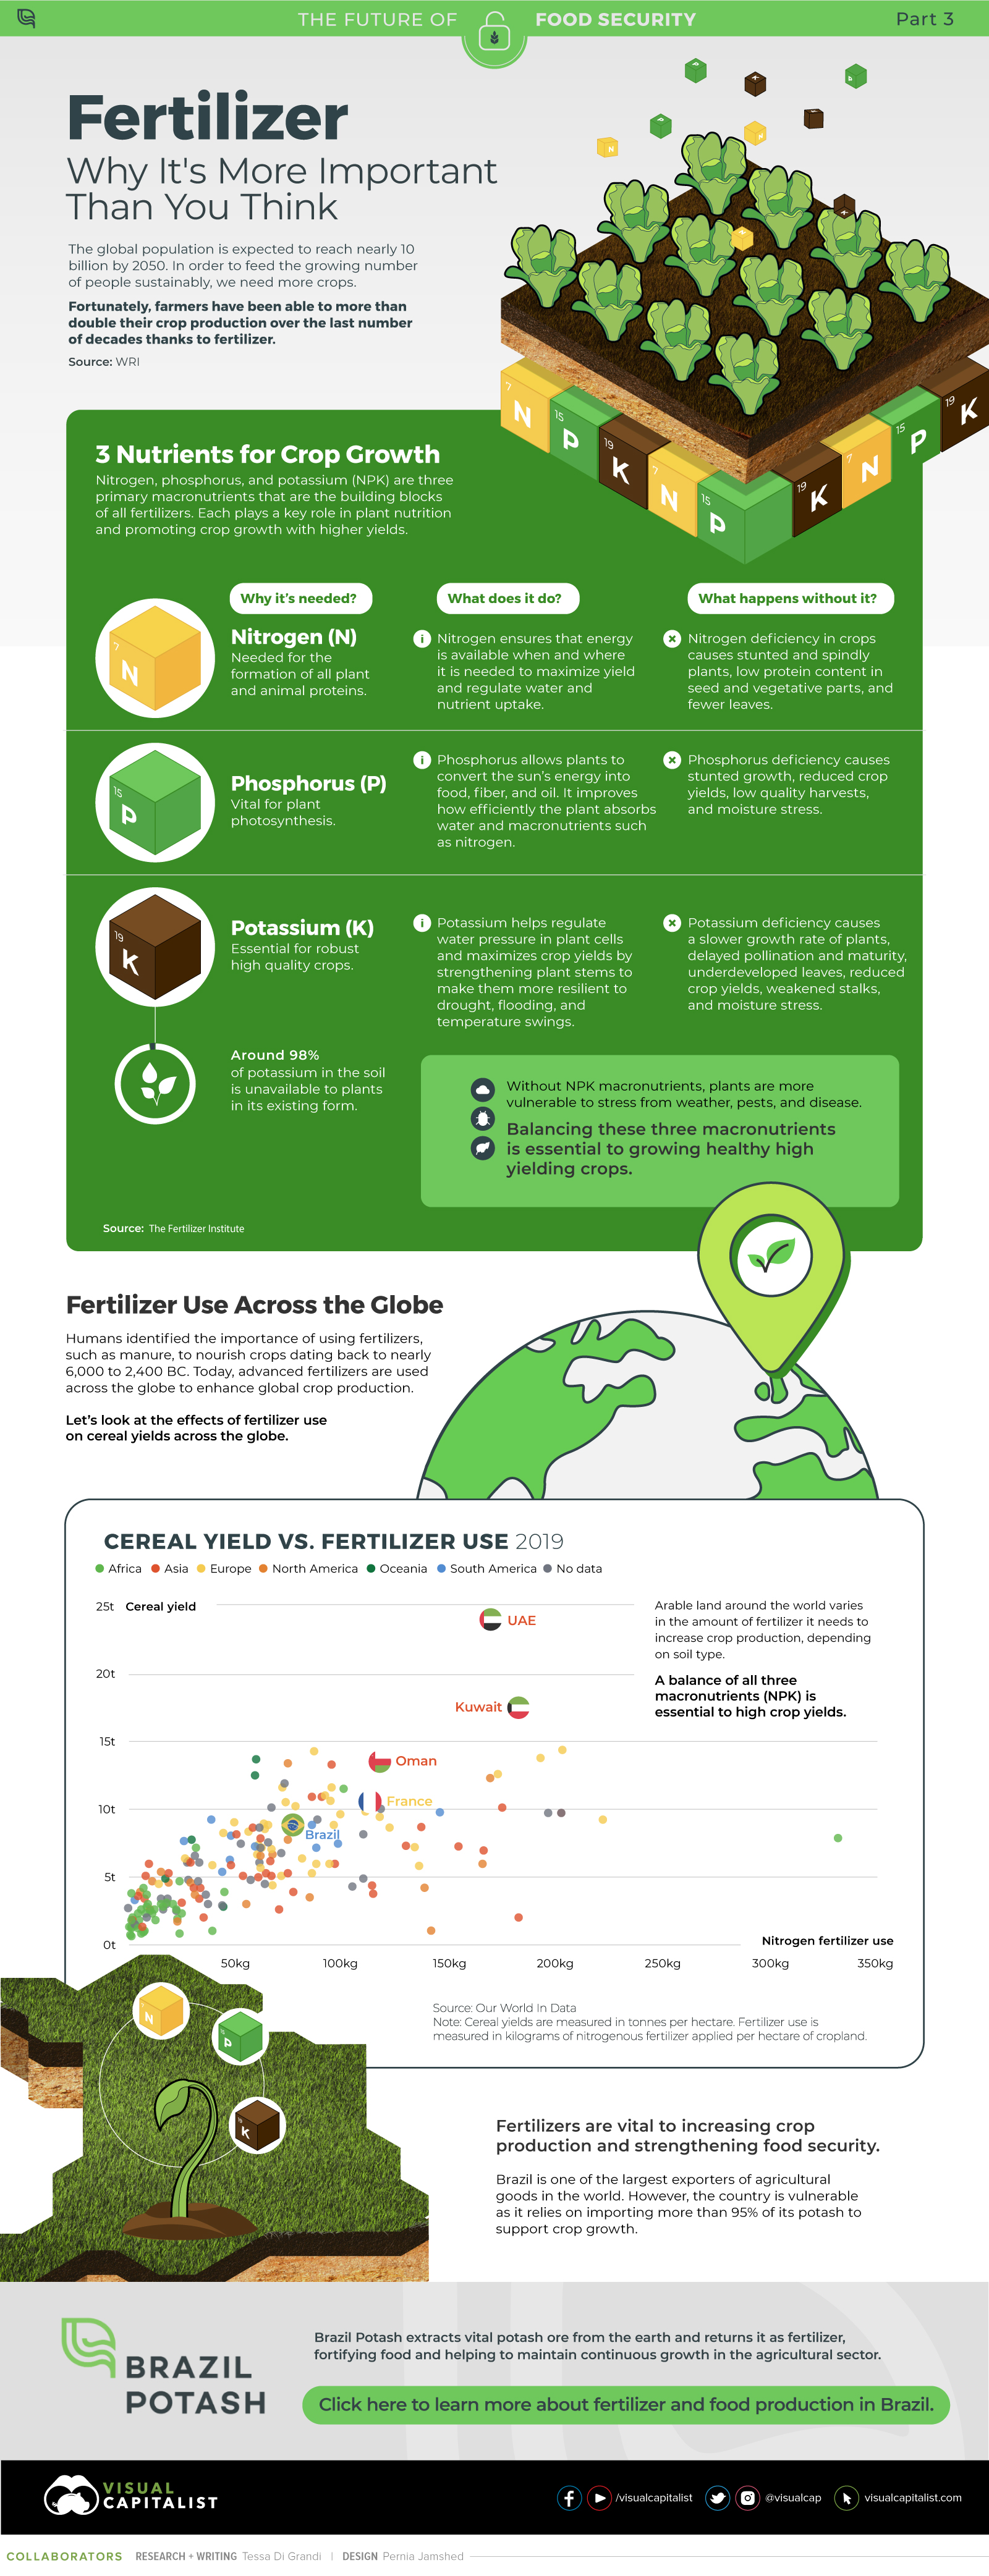
The Importance of Fertilizers
Humans identified the importance of using fertilizers, such as manure, to nourish crops dating back to nearly 6,000 to 2,400 BC. As agriculture became more intensive and large-scale, farmers began to experiment with different types of fertilizers. Today advanced chemical fertilizers are used across the globe to enhance global crop production. There are a myriad of factors that affect soil type, and so the farmable land must have a healthy balance of all three macronutrients to support high-yielding, healthy crops. Consequently, arable land around the world varies in the amount and type of fertilizer it needs. Fertilizers play an integral role in strengthening food security, and a supply of locally available fertilizer is needed in supporting global food systems in an ever-growing world. Brazil is one of the largest exporters of agricultural goods in the world. However, the country is vulnerable as it relies on importing more than 95% of its potash to support crop growth. Brazil Potash is developing a new potash project in Brazil to ensure a stable domestic source of this nutrient-rich fertilizer critical for global food security. Click here to learn more about fertilizer and food production in Brazil.