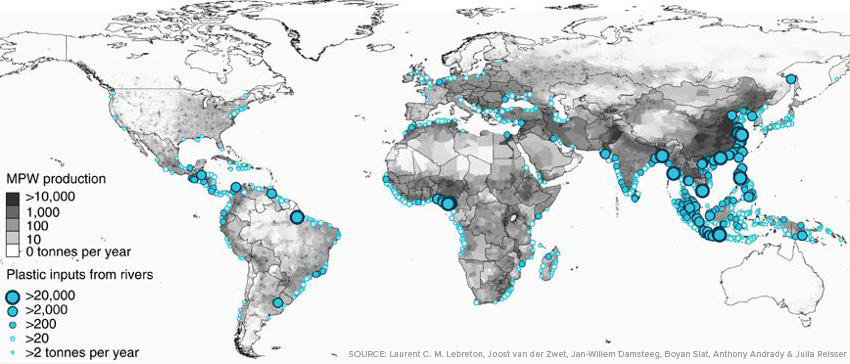
Every plastic fork and bottle cap bobbing along the surface of the ocean has made its way to the ocean from dry land at some point. As it turns out, the hydrological cycle that keeps water circulating around the planet is also an effective means for trash to hitch a ride from our riverside cities to the open ocean. As today’s unique, vintage-themed map – via John Nelson at ESRI – visualizes the shocking amount of plastic emitted by major rivers in the world.
Plastic Superhighways
It would be hard to overstate plastic’s influence on modern life. Unfortunately, when plastic is finished doing it’s job, only 10% of it ends up being recycled. Instead, much of the 300 million tonnes of plastic produced each year ends up in the ocean, congregating in places like the Pacific Garbage Patch. Plastic discharge is especially pronounced in large population centers along large rivers – particularly in rapidly urbanizing regions in China, Indonesia, and Nigeria.
Waste management practices are limited to non-existent in many of Asia’s fast-growing urban areas, so it comes as little surprise that 14 to the top 20 plastic emitting rivers are located on that continent. The mighty Yangtze – China’s largest river – supports a population of over 400 million people and is the most prolific emitter of plastic waste on the planet. Over 1.5 million metric tons of plastic is unleashed into the Yellow Sea from the river each year.
Stemming the Tide
Plastic emissions data makes one point clear – China is the key to decreasing the volume of trash entering our ocean ecosystems. The good news is that the Chinese government has recognized the problem, mandating garbage sorting in nearly 50 cities and setting a target for at 35% recycling rate by 2020. A positive first step in the battle to stem the tide of plastic entering ocean systems.
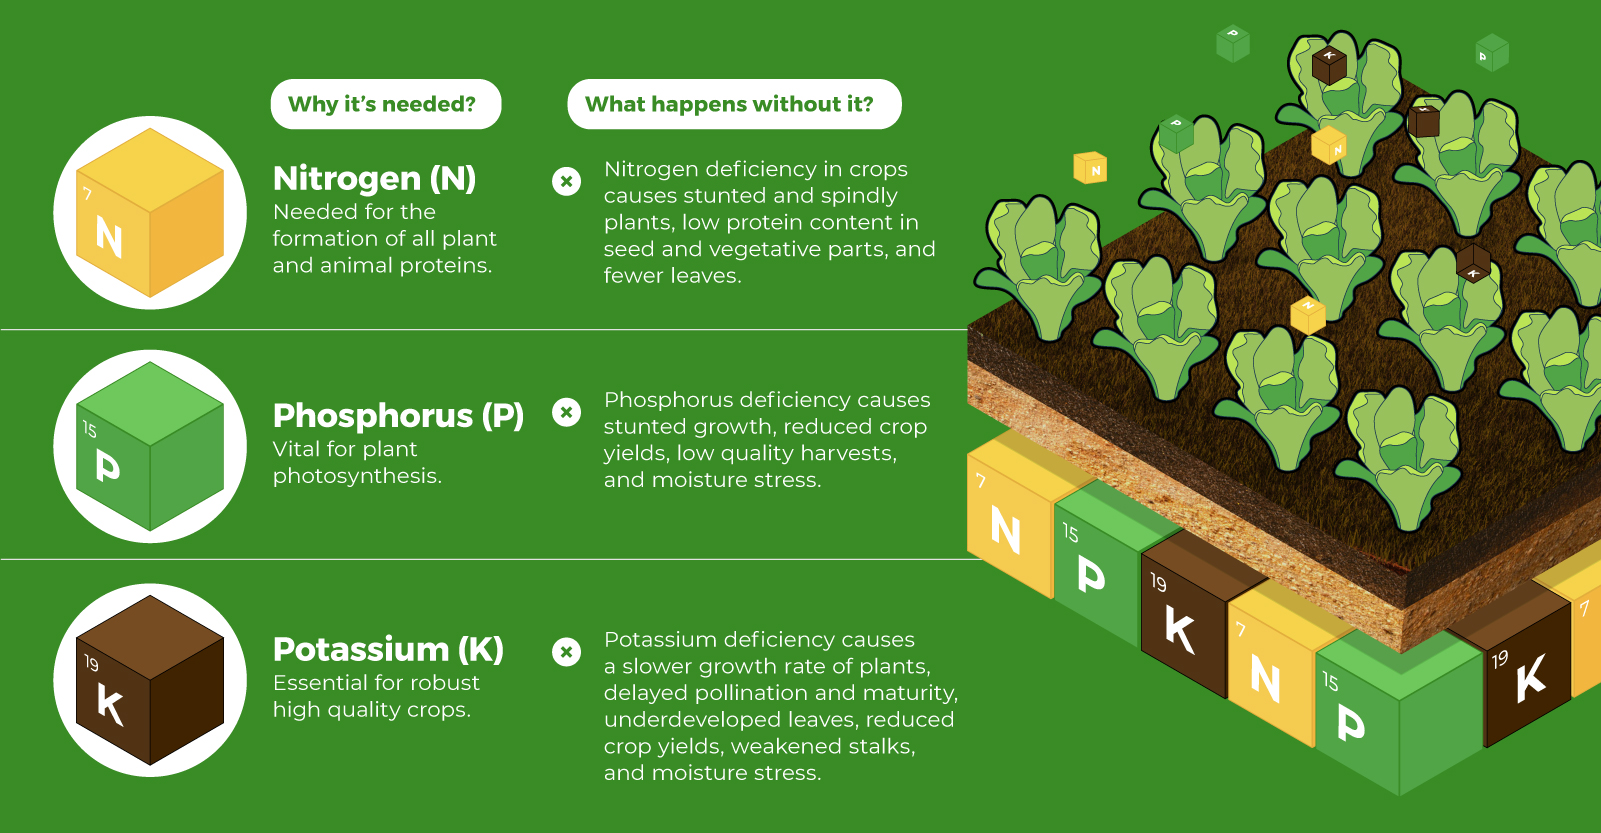
on Over recent decades, farmers have been able to more than double their production of crops thanks to fertilizers and the vital nutrients they contain. When crops are harvested, the essential nutrients are taken away with them to the dining table, resulting in the depletion of these nutrients in the soil. To replenish these nutrients, fertilizers are needed, and the cycle continues. The above infographic by Brazil Potash shows the role that each macronutrient plays in growing healthy, high-yielding crops.
Food for Growth
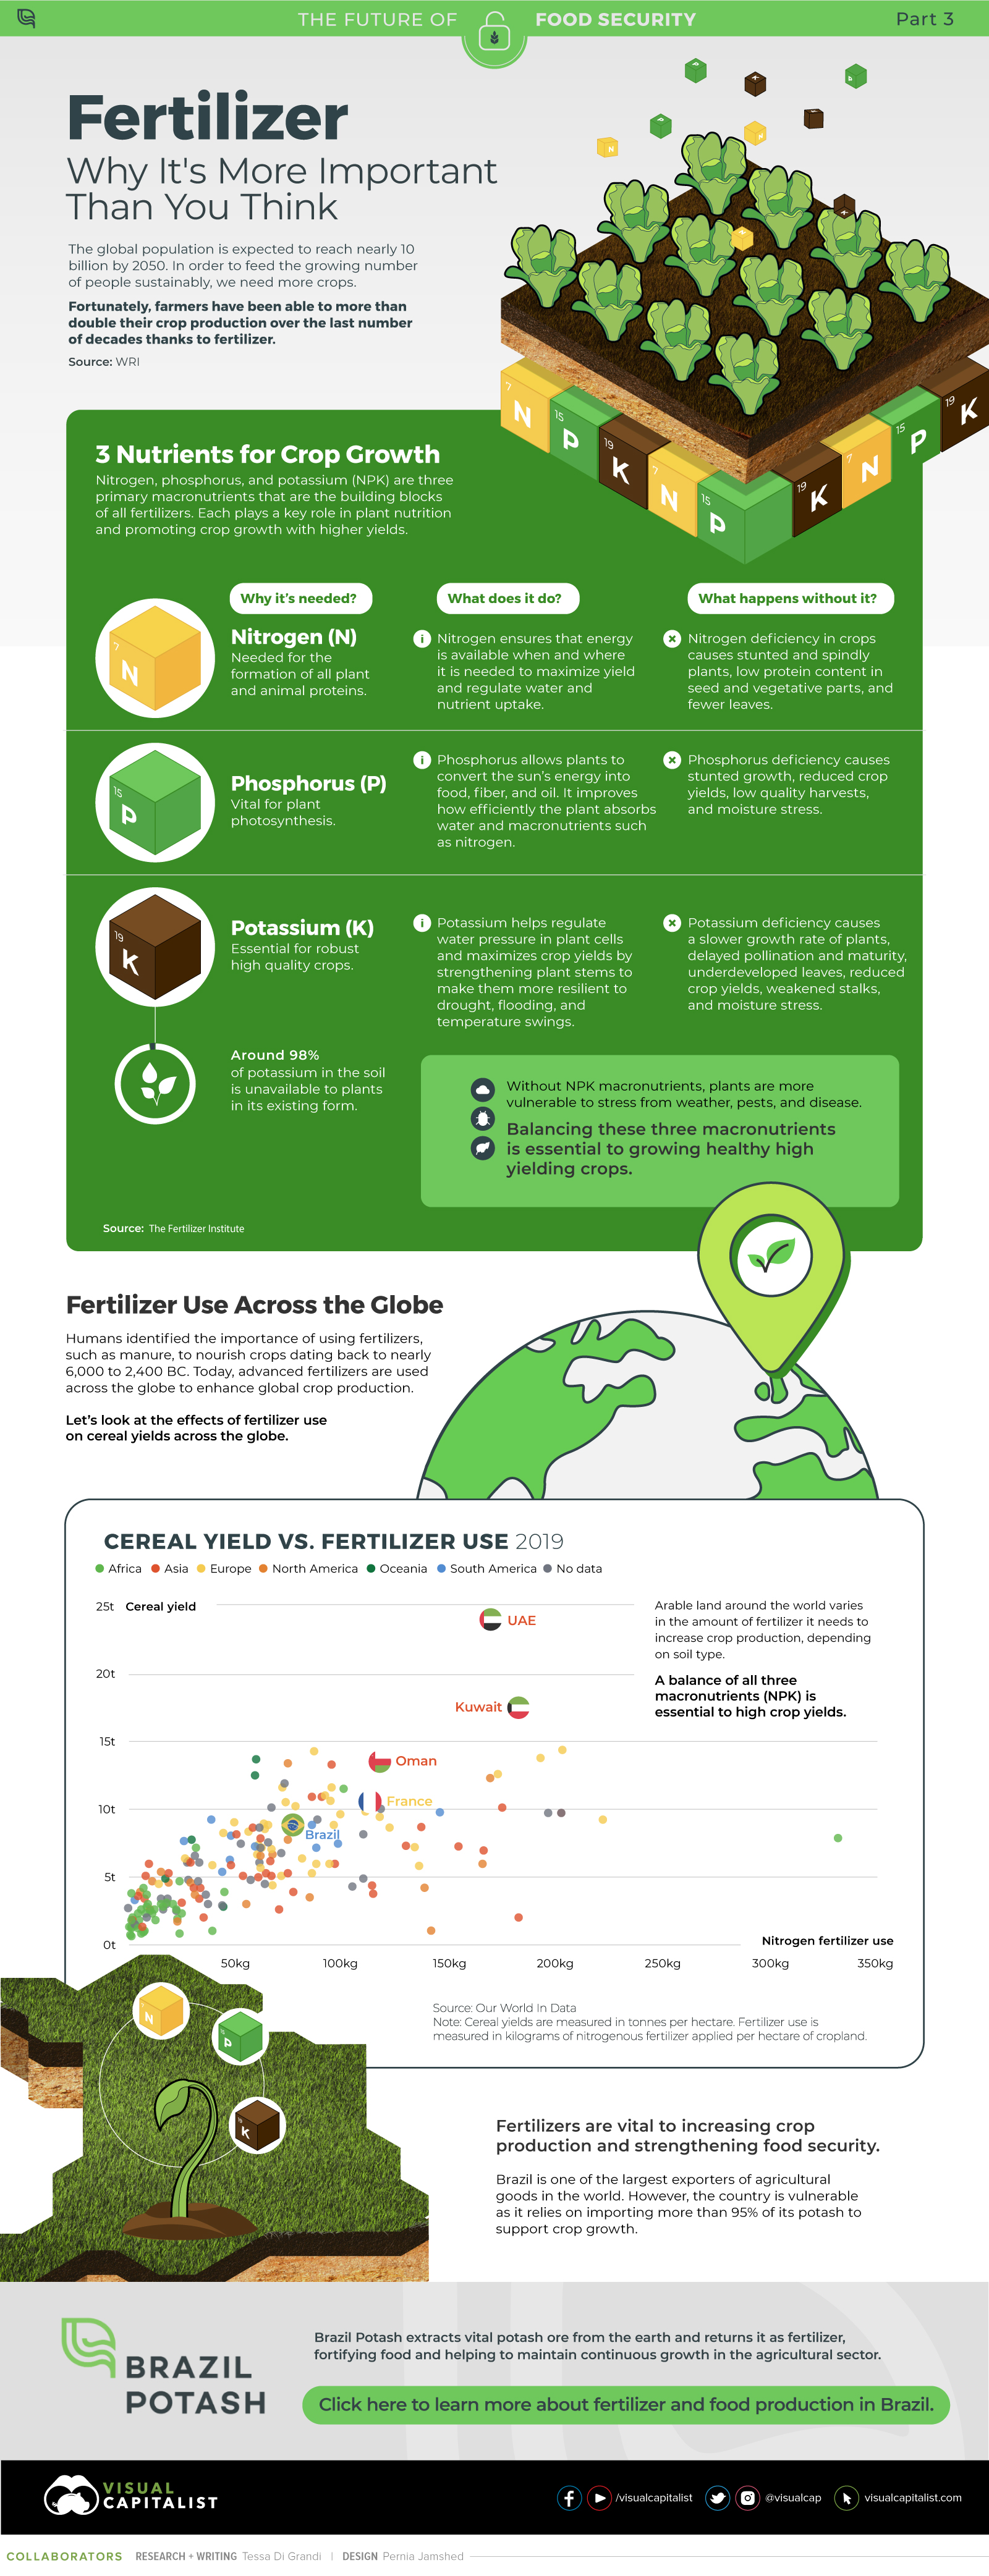
Nitrogen, phosphorus, and potassium (NPK) are three primary macronutrients that are the building blocks of the global fertilizer industry. Each plays a key role in plant nutrition and promoting crop growth with higher yields. Let’s take a look at how each macronutrient affects plant growth. If crops lack NPK macronutrients, they become vulnerable to various stresses caused by weather conditions, pests, and diseases. Therefore, it is crucial to maintain a balance of all three macronutrients for the production of healthy, high-yielding crops.
The Importance of Fertilizers
Humans identified the importance of using fertilizers, such as manure, to nourish crops dating back to nearly 6,000 to 2,400 BC. As agriculture became more intensive and large-scale, farmers began to experiment with different types of fertilizers. Today advanced chemical fertilizers are used across the globe to enhance global crop production. There are a myriad of factors that affect soil type, and so the farmable land must have a healthy balance of all three macronutrients to support high-yielding, healthy crops. Consequently, arable land around the world varies in the amount and type of fertilizer it needs. Fertilizers play an integral role in strengthening food security, and a supply of locally available fertilizer is needed in supporting global food systems in an ever-growing world. Brazil is one of the largest exporters of agricultural goods in the world. However, the country is vulnerable as it relies on importing more than 95% of its potash to support crop growth. Brazil Potash is developing a new potash project in Brazil to ensure a stable domestic source of this nutrient-rich fertilizer critical for global food security. Click here to learn more about fertilizer and food production in Brazil.