Initially marketed to investors as Index Participation Shares, this innovative new product was meant to be a proxy for the S&P 500 that also traded on an exchange like a stock. After being launched, this early ETF prototype was immediately targeted by lawyers of the Chicago Mercantile Exchange (CME) for illegally behaving like a futures contract. A lawsuit ensued, and a federal judge in Chicago ruled that they needed to be withdrawn. A year later, the case can be made that Canada was the birthplace of the first successful ETF. This time the product was called Toronto 35 Index Participation Units (TIPs 35), and it tracked the TSE-35 Index at the time. TIPs were instantly lauded for providing low-cost exposure to Canadian equities – and shortly after, many more ETFs in Canada and the United States would follow suit, including the SPDR S&P 500 Trust ETF in 1993.
How do ETFs work?
Today’s infographic from StocksToTrade.com highlights the basics around ETFs, including how they work, what type of assets they can track, and the pros and cons associated with investing in them. In the most basic sense, an ETF is a type of fund that owns assets – like stocks, commodities, or futures – but has its ownership divided into shares that trade on stock exchanges. In other words, investors can buy and sell ETFs whenever they want during trading hours. Like a stock, each ETF has a ticker symbol and a price that changes in real-time. However, unlike a stock, the number of shares outstanding can change daily based on the share creation and redemption mechanisms.
Pros and Cons
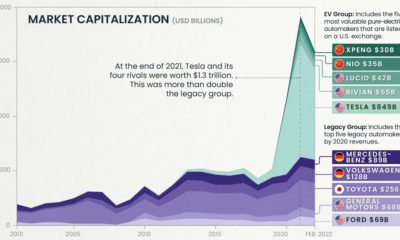
There are many views out there on ETFs, but it is generally accepted that they provide an inexpensive, transparent, and convenient way to get access to many different asset classes. This makes it easy to diversify a portfolio, and it also makes ETFs simple to buy and sell. For these reasons, the passive management investment industry has taken off, and the ETF industry now has over $4 trillion of assets under management (AUM) globally. By the year 2021, ETFs are expected to surpass the $7 trillion mark for AUM. Despite this growth and a wide range of benefits, ETFs do have some detractors. Critics would be quick to point out that some ETFs are very thinly traded, providing wide bid/ask spreads and lower liquidity. Furthermore, there can also be instances where technical issues can cause a performance gap between the ETF and the index it tracks, known as tracking error. As a final point, it’s worth mentioning that there is some counterparty risk with ETFs – for example, even if you “own” physically-backed gold through the SPDR Gold Trust (GLD), there is a chance that in extreme situations that you may not actually get to see the benefit of that gold. The counterparty risk stems from the possibility of a party failing to deliver on their promises, and is actually quite common to see with other types of assets, as well. on Last year, stock and bond returns tumbled after the Federal Reserve hiked interest rates at the fastest speed in 40 years. It was the first time in decades that both asset classes posted negative annual investment returns in tandem. Over four decades, this has happened 2.4% of the time across any 12-month rolling period. To look at how various stock and bond asset allocations have performed over history—and their broader correlations—the above graphic charts their best, worst, and average returns, using data from Vanguard.
How Has Asset Allocation Impacted Returns?
Based on data between 1926 and 2019, the table below looks at the spectrum of market returns of different asset allocations:
We can see that a portfolio made entirely of stocks returned 10.3% on average, the highest across all asset allocations. Of course, this came with wider return variance, hitting an annual low of -43% and a high of 54%.
A traditional 60/40 portfolio—which has lost its luster in recent years as low interest rates have led to lower bond returns—saw an average historical return of 8.8%. As interest rates have climbed in recent years, this may widen its appeal once again as bond returns may rise.
Meanwhile, a 100% bond portfolio averaged 5.3% in annual returns over the period. Bonds typically serve as a hedge against portfolio losses thanks to their typically negative historical correlation to stocks.
A Closer Look at Historical Correlations
To understand how 2022 was an outlier in terms of asset correlations we can look at the graphic below:
The last time stocks and bonds moved together in a negative direction was in 1969. At the time, inflation was accelerating and the Fed was hiking interest rates to cool rising costs. In fact, historically, when inflation surges, stocks and bonds have often moved in similar directions. Underscoring this divergence is real interest rate volatility. When real interest rates are a driving force in the market, as we have seen in the last year, it hurts both stock and bond returns. This is because higher interest rates can reduce the future cash flows of these investments. Adding another layer is the level of risk appetite among investors. When the economic outlook is uncertain and interest rate volatility is high, investors are more likely to take risk off their portfolios and demand higher returns for taking on higher risk. This can push down equity and bond prices. On the other hand, if the economic outlook is positive, investors may be willing to take on more risk, in turn potentially boosting equity prices.
Current Investment Returns in Context
Today, financial markets are seeing sharp swings as the ripple effects of higher interest rates are sinking in. For investors, historical data provides insight on long-term asset allocation trends. Over the last century, cycles of high interest rates have come and gone. Both equity and bond investment returns have been resilient for investors who stay the course.