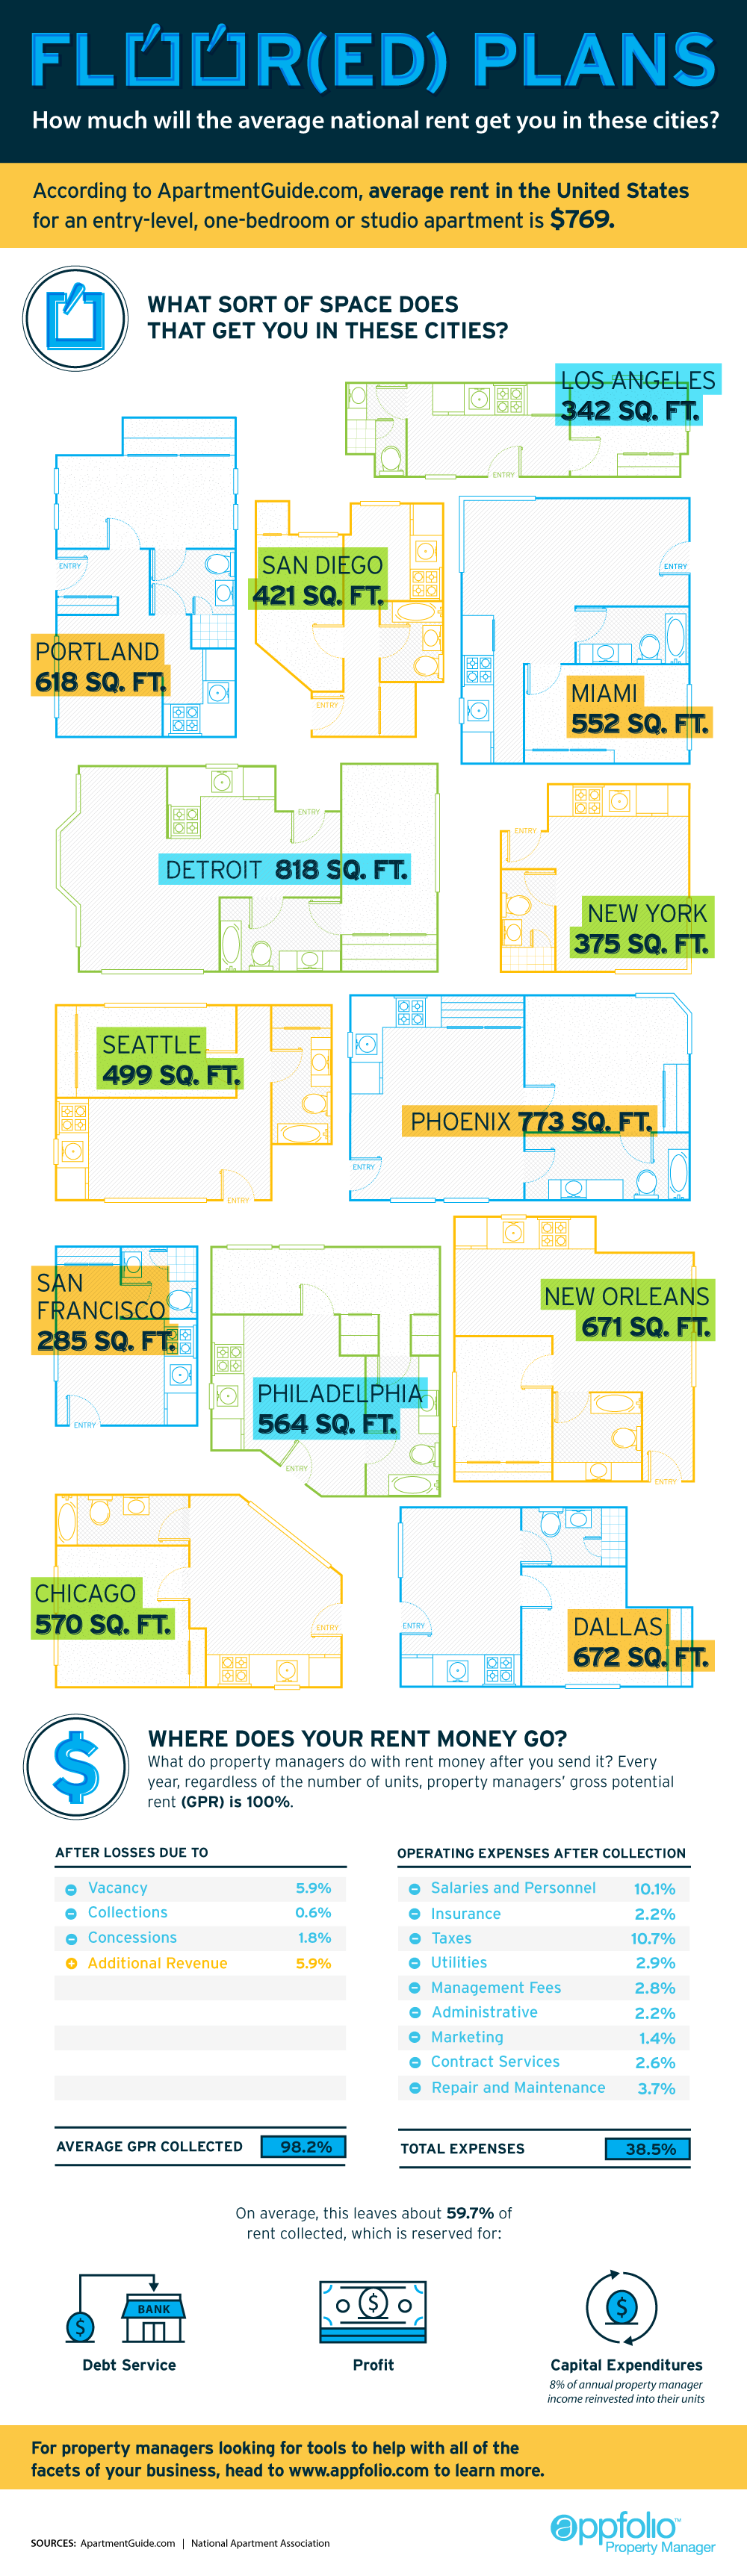
What Does the Average Rent Get You in These U.S. Cities?
Housing markets in general are linked to a variety of national variables: interest rates, unemployment, mortgage availability, consumer confidence, inflation, and overall economic health. However, they can also be extremely regional in nature, and this is why there can be such variations in domestic prices. Even though Canada still takes claim for the most overvalued housing market in the world, there are parts of America that look just as bubbly. This infographic looks at what renters could get in various cities while paying the average national monthly rent for an entry-level, one-bedroom or studio apartment ($769). The results vary. In Detroit, a city still emerging from its bankruptcy troubles, a renter could get 818 sq. ft. of space for the average rent. There is still some value in Chicago, Miami, and New Orleans, where the average national rent gets places of 570, 552, and 671 sq. ft. respectively. In the Big Apple, it is understandable that housing is hard to come by. The average amount can only get 375 sq. ft. However, where things really break down is in the Golden State, specifically in the Bay Area. New renters in San Francisco will find that the average national rent is only enough to get a kitchen and maybe a bathroom with just 285 sq. ft of space. Things are so bad in the city that shipping containers are getting converted to small homes and being rented out illegally for $1,000 per month. Someone even pitched a tent in their garden in Mountainview and listed it for $899 per month. The fuel for San Francisco’s housing woes lies in the influx of high-paying tech companies and jobs in Silicon Valley, foreign home buyers bidding up prices, complicated housing and renting regulations, lack of general supply, and stifling bureaucracy. Original graphic by: Mashable
on Cities become “expensive” due to a variety of factors such as high demand for housing, a concentration of high-paying businesses and industries, and a high standard of living. Additionally, factors such as taxes, transportation costs, and availability of goods and services can also contribute to the overall cost of living in global cities. The infographic above uses data from EIU to rank the world most and least expensive cities to live in. To make the list, the EIU examines 400+ prices for over 200 products and services in 172 cities, surveying a variety of businesses to track price fluctuations over the last year.
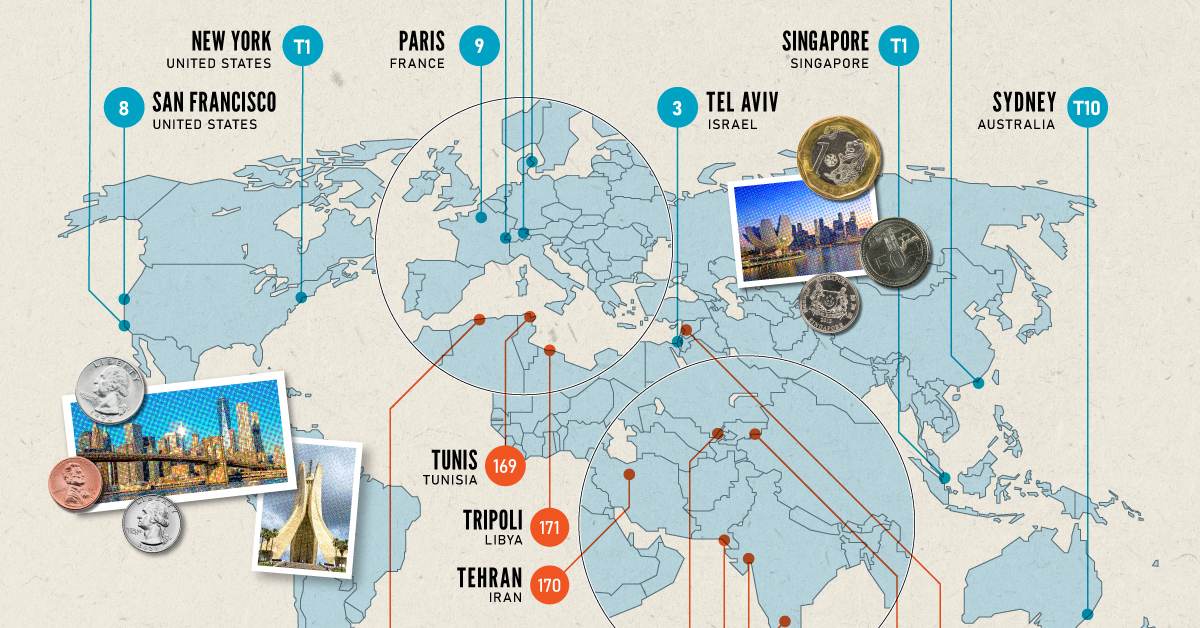
Inflation + Strong Currency = Expensive Cities
If you live in a city where many residents find it challenging to put a roof over their heads, food on their plates, and make ends meet, you live in an expensive city. But if this inflation is compounded with a strong national currency, you may live in one of the world’s most expensive cities. Singapore and New York City tied for the first rank amongst the world’s most expensive cities in 2022, pushing Israel’s Tel Aviv from the first place in 2021 to the third place in 2022. Both these cities had high inflation and a strong currency. Surprisingly, this is the Big Apple’s first time atop the ranking. The city with one of the most expensive real estate markets worldwide, Hong Kong ranked fourth in this list, followed by Los Angeles, which moved up from its ninth rank in 2021.
Poor Economies = Cheaper Cities
Asia continues to dominate the list of the world’s least expensive cities, followed by parts of North Africa and the Middle East. Though affordability sounds good at face value, sitting at the bottom of the ranking isn’t necessarily a coveted position. While the cost of living in some of the cities in these nations is low, it comes at the price of a weak currency, poor economy, and, in many cases, political and economic turmoil. The decade-long conflict in Syria weakened the Syrian pound, led to a spiraling inflation and fuel shortages, and further collapsed its economy. It’s no surprise that its capital city of Damascus has maintained its position as the world’s cheapest city. Tripoli and Tehran, the capitals of Libya and Iran, respectively, follow next on this list, reflecting their weakened economies. Meanwhile, seven cities in Asia with the common denominator of high-income inequality and low wages dominate the list of the world’s cheapest cities. These include three Indian cities, Tashkent in Uzbekistan, Almaty in Kazakhstan, Pakistan’s most populous city of Karachi, and Sri Lankan capital–Colombo.