In some places, such as the United States or Germany, economies are able to produce many different goods and services that get exported around the world. These countries tend to house world-class businesses in sectors like financials, technology, consumer goods, and healthcare, with companies that produce highly specialized goods like automobiles, software, or pharmaceutical products. Ultimately, these are innovative economies that can roll with the punches, creating growth even when prospects are dim. In other places, this level of sophistication is just not there. Innovation and knowledge are stunted or non-existent for most industries, and these countries may focus exclusively on one or two goods to pay the bills. Venezuela’s reliance on oil is an obvious example of this, but there are even many Western countries that miss the mark here as well.
Measuring Economic Complexity
In 2009, a team at Harvard formalized a measure of economic complexity that compared nations based on the sophistication of their economies. Now known as the Economic Complexity Index (ECI), the exact measurement is complicated, but it essentially uses data on two main things to uncover the underlying level of economic complexity:
- Economic Diversity Measures how many different products a country can produce.
- Economic Ubiquity Measures how many countries are able to make those products. In other words: if a country produces only a few goods, that economy is not very complex. Further, if a country produces many different products, but they are all simple ones that can be replicated elsewhere, the economy is still not complex. See full details on the project here.
Ranking the Most Complex Economies
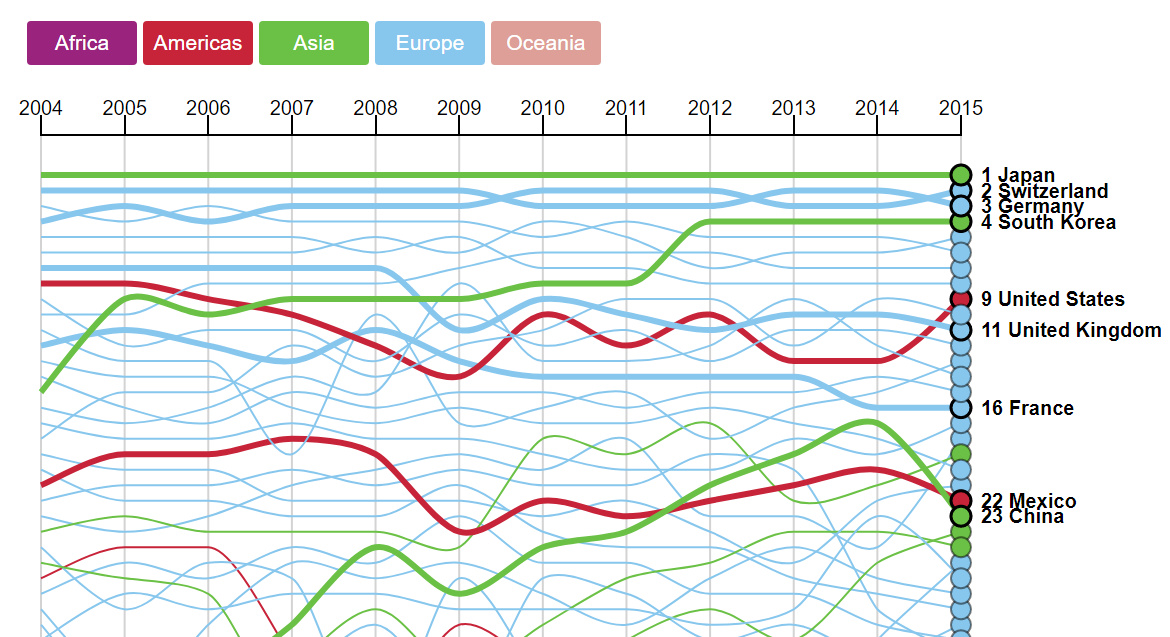
Here are the most complex economies in order, along with the changing rankings over time:
As you’ll notice, the most recent set of data is from 2015. Topping the list are the economies of Japan (1st), Switzerland (2nd), Germany (3rd), and South Korea (4th). The United States sits in 9th place, and Canada is further down at 33rd. Australia, which relies heavily on commodities, ranks notably low for Western countries in 73rd place, where it is sandwiched between Kazakhstan and the Dominican Republic.
Movers and Shakers
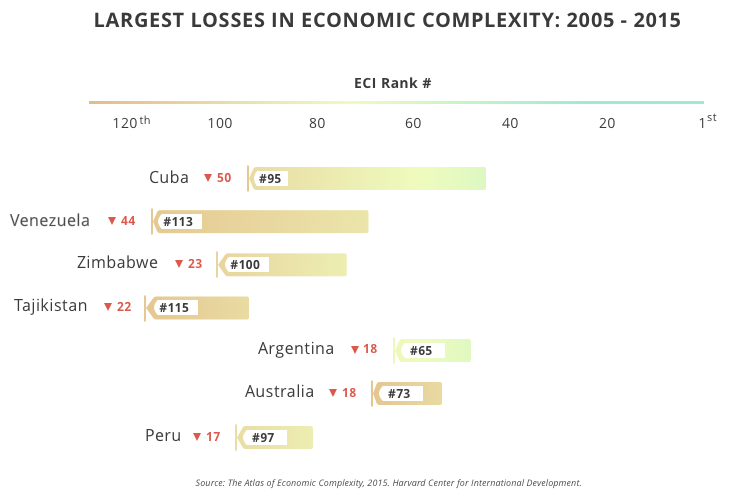
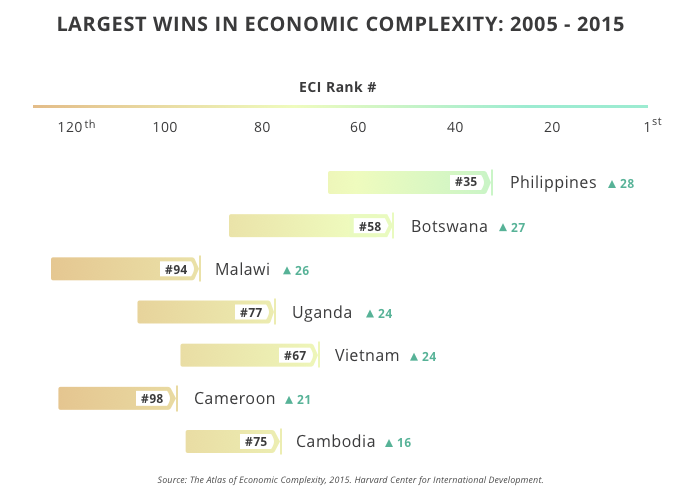
The most recent iteration of the index also highlighted some movers and shakers over the last 10 year period:
In particular, the crisis in Venezuela has had an effect on economic complexity, eroding any sophistication that existed. Meanwhile, Cuba’s economy is also in the decline in terms of sophistication – and with major exports including raw sugar (27%), rolled tobacco (15%), nickel (12%), oil (11%), hard liquor (7%), and crustaceans (4%), it’s not hard to see why.
On the opposite side of the spectrum, the Philippines is the biggest mover upwards, ascending 28 spots. Some African countries are also moving fast up the rankings: Botswana, Malawi, Uganda, and Cameroon each jumped over 20 spots.
on Both figures surpassed analyst expectations by a wide margin, and in January, the unemployment rate hit a 53-year low of 3.4%. With the recent release of February’s numbers, unemployment is now reported at a slightly higher 3.6%. A low unemployment rate is a classic sign of a strong economy. However, as this visualization shows, unemployment often reaches a cyclical low point right before a recession materializes.
Reasons for the Trend
In an interview regarding the January jobs data, U.S. Treasury Secretary Janet Yellen made a bold statement: While there’s nothing wrong with this assessment, the trend we’ve highlighted suggests that Yellen may need to backtrack in the near future. So why do recessions tend to begin after unemployment bottoms out?
The Economic Cycle
The economic cycle refers to the economy’s natural tendency to fluctuate between periods of growth and recession. This can be thought of similarly to the four seasons in a year. An economy expands (spring), reaches a peak (summer), begins to contract (fall), then hits a trough (winter). With this in mind, it’s reasonable to assume that a cyclical low in the unemployment rate (peak employment) is simply a sign that the economy has reached a high point.
Monetary Policy
During periods of low unemployment, employers may have a harder time finding workers. This forces them to offer higher wages, which can contribute to inflation. For context, consider the labor shortage that emerged following the COVID-19 pandemic. We can see that U.S. wage growth (represented by a three-month moving average) has climbed substantially, and has held above 6% since March 2022. The Federal Reserve, whose mandate is to ensure price stability, will take measures to prevent inflation from climbing too far. In practice, this involves raising interest rates, which makes borrowing more expensive and dampens economic activity. Companies are less likely to expand, reducing investment and cutting jobs. Consumers, on the other hand, reduce the amount of large purchases they make. Because of these reactions, some believe that aggressive rate hikes by the Fed can either cause a recession, or make them worse. This is supported by recent research, which found that since 1950, central banks have been unable to slow inflation without a recession occurring shortly after.
Politicians Clash With Economists
The Fed has raised interest rates at an unprecedented pace since March 2022 to combat high inflation. More recently, Fed Chairman Jerome Powell warned that interest rates could be raised even higher than originally expected if inflation continues above target. Senator Elizabeth Warren expressed concern that this would cost Americans their jobs, and ultimately, cause a recession. Powell remains committed to bringing down inflation, but with the recent failures of Silicon Valley Bank and Signature Bank, some analysts believe there could be a pause coming in interest rate hikes. Editor’s note: just after publication of this article, it was confirmed that U.S. interest rates were hiked by 25 basis points (bps) by the Federal Reserve.