If an area sees a high number of migrants, along with a strong birth rate and low death rate, then its population is bound to increase over time. On the flip side, if more people are leaving the area than coming in, and the region’s birth rate is low, then its population will likely decline. Which areas in the United States are seeing the most growth, and which places are seeing their populations dwindle? This map, using data from the U.S. Census Bureau, shows a decade of population movement across U.S. counties, painting a detailed picture of U.S. population growth between 2010 and 2020.
Counties With The Biggest Population Growth from 2010-2020
To calculate population estimates for each county, the U.S. Census Bureau does the following calculations: From 2010 to 2020, Maricopa County in Arizona saw the highest increase in its population estimate. Over a decade, the county gained 753,898 residents. Below are the counties that saw the biggest increases in population: Phoenix and surrounding areas grew faster than any other major city in the country. The region’s sunny climate and amenities are popular with retirees, but another draw is housing affordability. Families from more expensive markets—California in particular—are moving to the city in droves. This is a trend that spilled over into the pandemic era as more people moved into remote and hybrid work situations. Texas counties saw a lot of growth as well, with five of the top 10 gainers located in the state of Texas. A big draw for Texas is its relatively affordable housing market. In 2021, average home prices in the state stood at $172,500—$53,310 below the national average.
Counties With The Biggest Population Drops from 2010-2020
On the opposite end of the spectrum, here’s a look at the top 10 counties that saw the biggest declines in their populations over the decade: The largest drops happened in counties along the Great Lakes, including Cook County (which includes the city of Chicago) and Wayne County (which includes the city of Detroit). For many of these counties, particularly those in America’s “Rust Belt”, population drops over this period were a continuation of decades-long trends. Wayne County is an extreme example of this trend. From 1970 to 2020, the area lost one-third of its population.
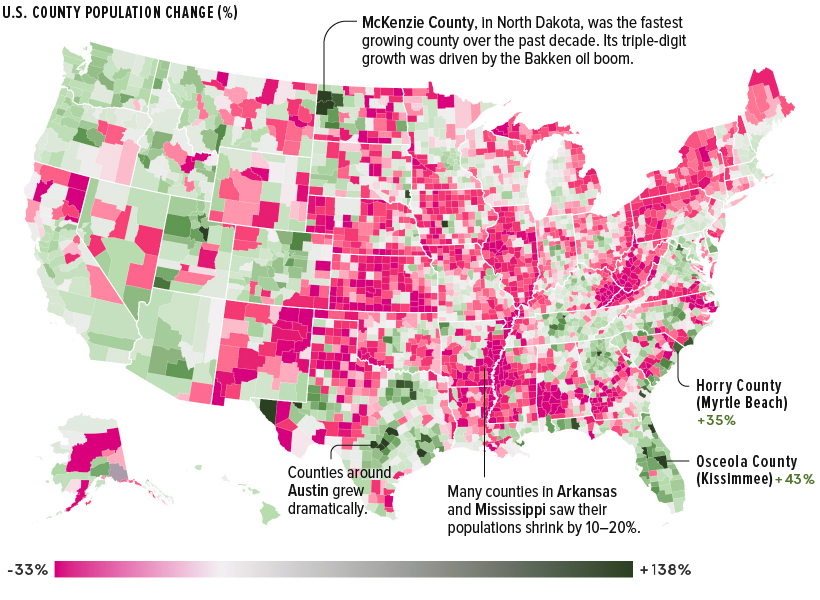
U.S. Population Growth in Percentage Terms (2010-2020)
While the map above is great at showing where the greatest number of Americans migrated, it downplays big changes in counties with smaller populations. For example, McKenzie County in North Dakota, with a 2020 population of just 15,242, was the fastest-growing U.S. county over the past decade. The county’s 138% increase was driven primarily by the Bakken oil boom in the area. High-growth counties in Texas also grew as new sources of energy were extracted in rural areas. The nation’s counties are evenly divided between population increase and decline, and clear patterns emerge.
Pandemic Population Changes
More recent population changes reflect longer-term trends. During the COVID-19 pandemic, many of the counties that saw the strongest population increases were located in high-growth states like Florida and Texas. Below are the 20 counties that grew the most from 2020 to 2021. Many of these counties are located next to large cities, reflecting a shift to the suburbs and larger living spaces. However, as COVID-19 restrictions ease, and the pandemic housing boom tapers off due to rising interest rates, it remains to be seen whether the suburban shift will continue, or if people begin to migrate back to city centers. on Even while political regimes across these countries have changed over time, they’ve largely followed a few different types of governance. Today, every country can ultimately be classified into just nine broad forms of government systems. This map by Truman Du uses information from Wikipedia to map the government systems that rule the world today.
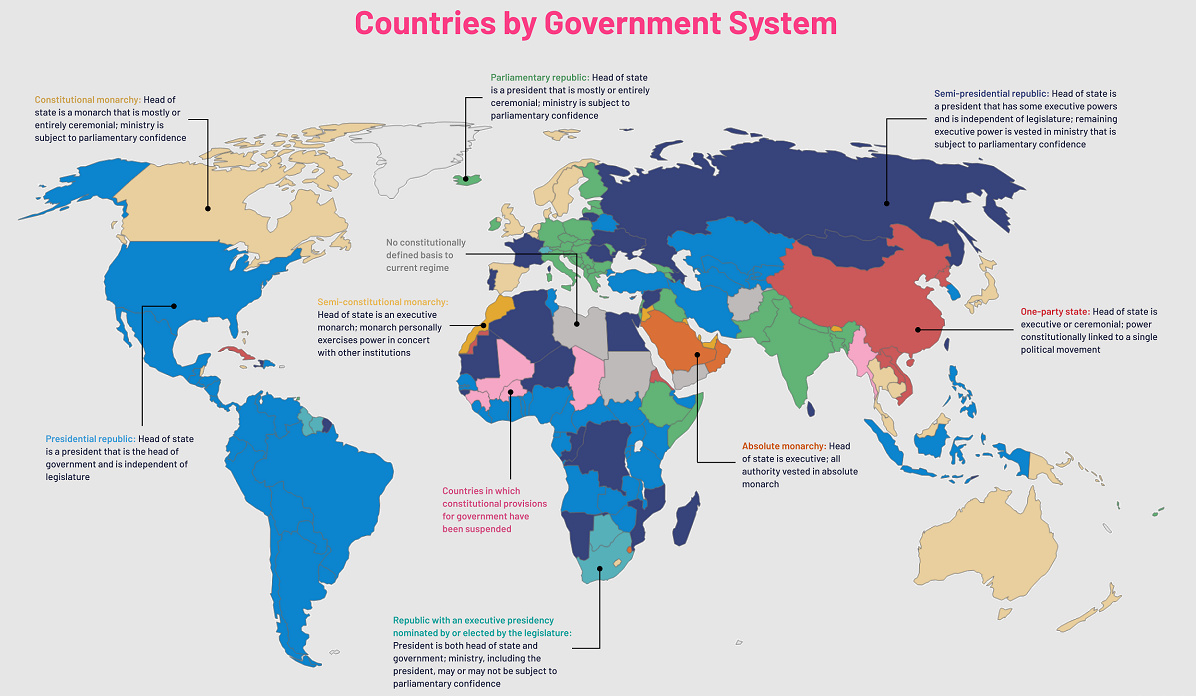
Countries By Type of Government
It’s important to note that this map charts government systems according to each country’s legal framework. Many countries have constitutions stating their de jure or legally recognized system of government, but their de facto or realized form of governance may be quite different. Here is a list of the stated government system of UN member states and observers as of January 2023: Let’s take a closer look at some of these systems.
Monarchies
Brought back into the spotlight after the death of Queen Elizabeth II of England in September 2022, this form of government has a single ruler. They carry titles from king and queen to sultan or emperor, and their government systems can be further divided into three modern types: constitutional, semi-constitutional, and absolute. A constitutional monarchy sees the monarch act as head of state within the parameters of a constitution, giving them little to no real power. For example, King Charles III is the head of 15 Commonwealth nations including Canada and Australia. However, each has their own head of government. On the other hand, a semi-constitutional monarchy lets the monarch or ruling royal family retain substantial political powers, as is the case in Jordan and Morocco. However, their monarchs still rule the country according to a democratic constitution and in concert with other institutions. Finally, an absolute monarchy is most like the monarchies of old, where the ruler has full power over governance, with modern examples including Saudi Arabia and Vatican City.
Republics
Unlike monarchies, the people hold the power in a republic government system, directly electing representatives to form government. Again, there are multiple types of modern republic governments: presidential, semi-presidential, and parliamentary. The presidential republic could be considered a direct progression from monarchies. This system has a strong and independent chief executive with extensive powers when it comes to domestic affairs and foreign policy. An example of this is the United States, where the President is both the head of state and the head of government. In a semi-presidential republic, the president is the head of state and has some executive powers that are independent of the legislature. However, the prime minister (or chancellor or equivalent title) is the head of government, responsible to the legislature along with the cabinet. Russia is a classic example of this type of government. The last type of republic system is parliamentary. In this system, the president is a figurehead, while the head of government holds real power and is validated by and accountable to the parliament. This type of system can be seen in Germany, Italy, and India and is akin to constitutional monarchies. It’s also important to point out that some parliamentary republic systems operate slightly differently. For example in South Africa, the president is both the head of state and government, but is elected directly by the legislature. This leaves them (and their ministries) potentially subject to parliamentary confidence.
One-Party State
Many of the systems above involve multiple political parties vying to rule and govern their respective countries. In a one-party state, also called a single-party state or single-party system, only one political party has the right to form government. All other political parties are either outlawed or only allowed limited participation in elections. In this system, a country’s head of state and head of government can be executive or ceremonial but political power is constitutionally linked to a single political movement. China is the most well-known example of this government system, with the General Secretary of the Communist Party of China ruling as the de facto leader since 1989.
Provisional
The final form of government is a provisional government formed as an interim or transitional government. In this system, an emergency governmental body is created to manage political transitions after the collapse of a government, or when a new state is formed. Often these evolve into fully constitutionalized systems, but sometimes they hold power for longer than expected. Some examples of countries that are considered provisional include Libya, Burkina Faso, and Chad.