Devastating floods across Pakistan this summer have resulted in more than 1,400 lives lost and one-third of the country being under water. This raises the question: which nations and their populations are the most vulnerable to the risk of flooding around the world? Using data from a recent study published in Nature, this graphic maps flood risk around the world, highlighting the 1.81 billion people directly exposed to 1-in-100 year floods. The methodology takes into account potential risks from both inland and coastal flooding.
Asian Countries Most at Risk from Rising Water Levels
Not surprisingly, countries with considerable coastlines, river systems, and flatlands find themselves with high percentages of their population at risk. The Netherlands and Bangladesh are the only two nations in the world to have more than half of their population at risk due to flooding, at 59% and 58%, respectively. Vietnam (46%), Egypt (41%), and Myanmar (40%) round out the rest of the top five nations. Besides the Netherlands, only two other European nations are in the top 20 nations by percentage of population at risk, Austria (18th at 29%) and Albania (20th at 28%). The Southeast Asia region alone makes up more than two-thirds of the global population exposed to flooding risk at 1.24 billion people. China and India account for 395 million and 390 million people, respectively, with both nations at the top in terms of the absolute number of people at risk of rising water levels. The rest of the top five countries by total population at risk are Bangladesh (94 million people at risk), Indonesia (76 million people at risk), and Pakistan (72 million people at risk).
How Flooding is Already Affecting Countries Like Pakistan
While forecasted climate and natural disasters can often take years to manifest, flooding affected more than 100 million people in 2021. Recent summer floods in Pakistan have continued the trend in 2022. With 31% of its population (72 million people) at risk of flooding, Pakistan is particularly vulnerable to floods. In 2010, floods in Pakistan were estimated to have affected more than 18 million people. The recent floods, which started in June, are estimated to have affected more than 33 million people as more than one-third of the country is submerged underwater.
The Cost of Floods Today and in the Future
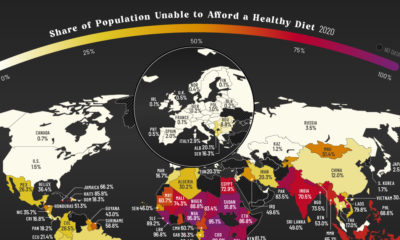
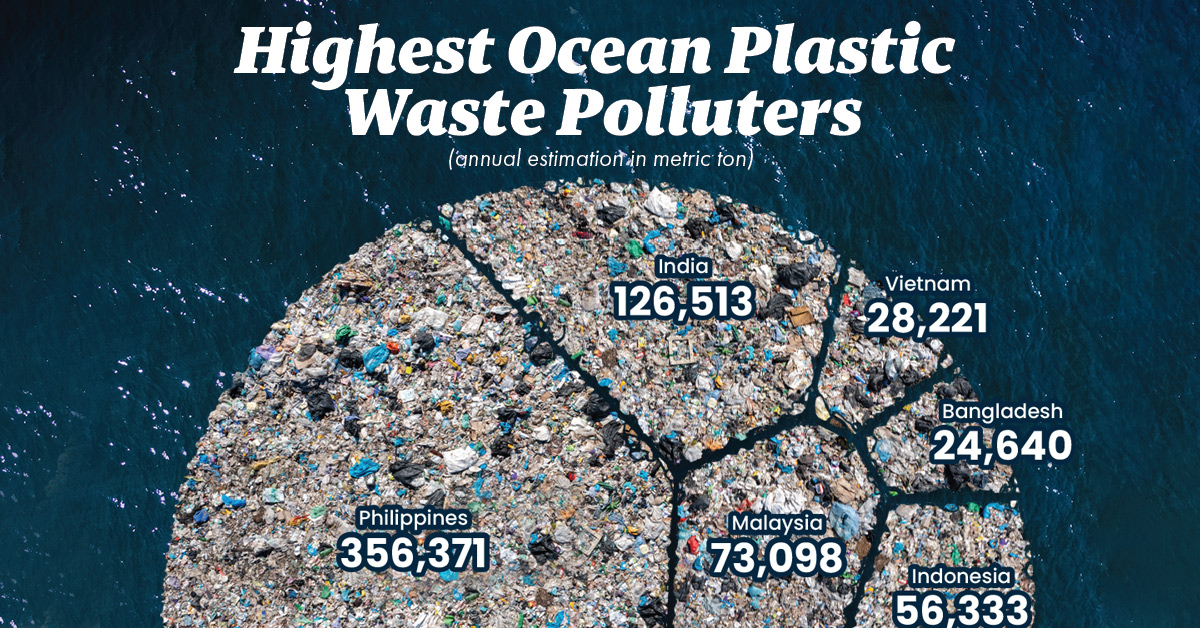
Although the rising human toll is by far the biggest concern that floods present, they also bring with them massive economic costs. Last year, droughts, floods, and storms caused economic losses totaling $224.2 billion worldwide, nearly doubling the 2001-2020 annual average of $117.8 billion. A recent report forecasted that water risk (caused by droughts, floods, and storms) could eat up $5.6 trillion of global GDP by 2050, with floods projected to account for 36% of these direct losses. As both human and economic losses caused by floods continue to mount, nations around the world will need to focus on preventative infrastructure and restorative solutions for ecosystems and communities already affected and most at risk of flooding. on In fact, many pieces of ocean plastic waste have come together to create a vortex of plastic waste thrice the size of France in the Pacific Ocean between California and Hawaii. Where does all of this plastic come from? In this graphic, Louis Lugas Wicaksono used data from a research paper by Lourens J.J. Meijer and team to highlight the top 10 countries emitting plastic pollutants in the waters surrounding them.
Plastic’s Ocean Voyage
First, let’s talk about how this plastic waste reaches the oceans in the first place. Most of the plastic waste found in the deep blue waters comes from the litter in parks, beaches, or along the storm drains lining our streets. These bits of plastic waste are carried into our drains, streams, and rivers by wind and rainwater runoff. The rivers then turn into plastic superhighways, transporting the plastic to the oceans. A large additional chunk of ocean plastic comes from damaged fishing nets or ghost nets that are directly discarded into the high seas.
Countries Feeding the Plastic Problem
Some might think that the countries producing or consuming the most plastic are the ones that pollute the oceans the most. But that’s not true. According to the study, countries with a smaller geographical area, longer coastlines, high rainfall, and poor waste management systems are more likely to wash plastics into the sea. For example, China generates 10 times the plastic waste that Malaysia does. However, 9% of Malaysia’s total plastic waste is estimated to reach the ocean, in comparison to China’s 0.6%. The Philippines—an archipelago of over 7,000 islands, with a 36,289 kilometer coastline and 4,820 plastic emitting rivers—is estimated to emit 35% of the ocean’s plastic. In addition to the Philippines, over 75% of the accumulated plastic in the ocean is reported to come from the mismanaged waste in Asian countries including India, Malaysia, China, Indonesia, Myanmar, Vietnam, Bangladesh, and Thailand.
The Path to a Plastic-free Ocean
The first, and most obvious, way to reduce plastic accumulation is to reduce the use of plastic. Lesser production equals lesser waste. The second step is managing the plastic waste generated, and this is where the challenge lies. Many high-income countries generate high amounts of plastic waste, but are either better at processing it or exporting it to other countries. Meanwhile, many of the middle-income and low-income countries that both demand plastics and receive bulk exports have yet to develop the infrastructure needed to process it.