Cities become “expensive” due to a variety of factors such as high demand for housing, a concentration of high-paying businesses and industries, and a high standard of living. Additionally, factors such as taxes, transportation costs, and availability of goods and services can also contribute to the overall cost of living in global cities. The infographic above uses data from EIU to rank the world most and least expensive cities to live in. To make the list, the EIU examines 400+ prices for over 200 products and services in 172 cities, surveying a variety of businesses to track price fluctuations over the last year.
Inflation + Strong Currency = Expensive Cities
If you live in a city where many residents find it challenging to put a roof over their heads, food on their plates, and make ends meet, you live in an expensive city. But if this inflation is compounded with a strong national currency, you may live in one of the world’s most expensive cities. Singapore and New York City tied for the first rank amongst the world’s most expensive cities in 2022, pushing Israel’s Tel Aviv from the first place in 2021 to the third place in 2022. Both these cities had high inflation and a strong currency. Surprisingly, this is the Big Apple’s first time atop the ranking. The city with one of the most expensive real estate markets worldwide, Hong Kong ranked fourth in this list, followed by Los Angeles, which moved up from its ninth rank in 2021.
Poor Economies = Cheaper Cities
Asia continues to dominate the list of the world’s least expensive cities, followed by parts of North Africa and the Middle East. Though affordability sounds good at face value, sitting at the bottom of the ranking isn’t necessarily a coveted position. While the cost of living in some of the cities in these nations is low, it comes at the price of a weak currency, poor economy, and, in many cases, political and economic turmoil. The decade-long conflict in Syria weakened the Syrian pound, led to a spiraling inflation and fuel shortages, and further collapsed its economy. It’s no surprise that its capital city of Damascus has maintained its position as the world’s cheapest city. Tripoli and Tehran, the capitals of Libya and Iran, respectively, follow next on this list, reflecting their weakened economies. Meanwhile, seven cities in Asia with the common denominator of high-income inequality and low wages dominate the list of the world’s cheapest cities. These include three Indian cities, Tashkent in Uzbekistan, Almaty in Kazakhstan, Pakistan’s most populous city of Karachi, and Sri Lankan capital–Colombo. on The visualization above looks to give people a different frame of reference to think about the country’s massive population figures.
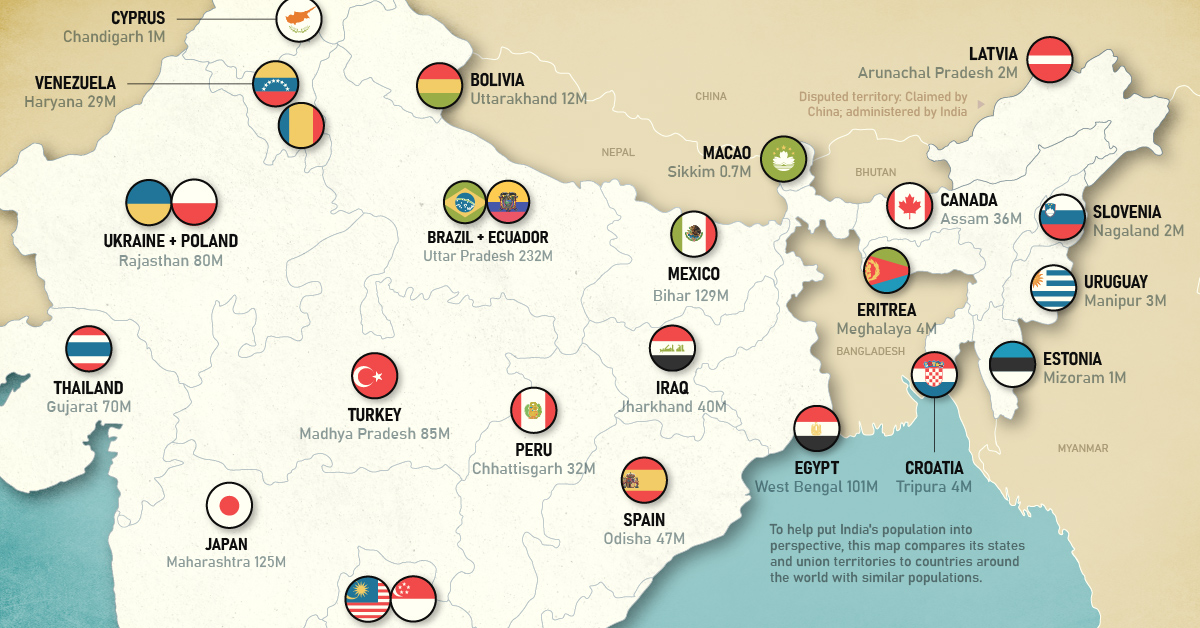
The Population Breakdown
Similar to other big countries, the gap between India’s largest and smallest states is quite wide. Uttar Pradesh is the most populous country subdivision in the world at 232 million people, while Sikkim, in the northeast of the country, is the least populated state in India (0.7 million). Here are India’s 28 states and 8 union territories compared to other countries and territories with comparable sizes: Hypothetically, if India’s states were to all became countries today, they would take up half the spots in a ranking of the world’s top 20 most populous countries. A number of Indian states match up evenly against some very large countries, including Maharashtra (Japan), West Bengal (Egypt), and Tamil Nadu (Germany). Of course, the largest is Uttar Pradesh (Brazil+Chile), which also happens to measure up to neighboring Pakistan. For people living in countries such as Canada or Australia, it may be humbling to know that these countries are equal to a smallish Indian state.
The Big Get Bigger
According to United Nations projections, India is on track to become the most populous country in the world in 2023. The population of India’s growth is fueled by several factors, including declining mortality rates, increased life expectancy, and high birth rates. While India’s population growth has slowed in recent years due to factors such as urbanization and increasing access to contraception, the country’s population is still expected to continue growing at a significant rate for the foreseeable future. Source: Population projections for India are from indiacensus.net. Population figures for comparison countries are from the UN’s World Population Prospects: The 2019 Revision (medium-fertility variant), accessed via Worldometers‘ live tracker. All population figures shown are 2022 projections. Data note: Because there are only so many countries, the populations of comparison countries may not perfectly match that of the various Indian states and union territories. Numbers are rounded. Map note: A number of borders and regions in India are disputed with other countries. Our depiction of borders is a good faith, apolitical attempt at reflecting the “de facto” situation in each region.