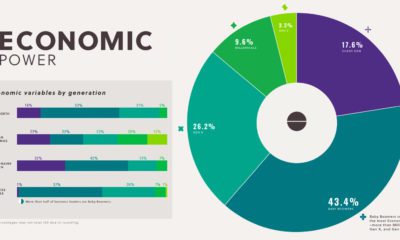
While mom and pop might not always be in focus, collectively small businesses are a powerful and influential piece of the economy. In fact, 99.9% of all businesses in the U.S. qualify as small businesses, collectively employing almost half (47.3%) of the nation’s private workforce. Unfortunately, they’ve also been one of the hardest-hit sectors of the economy amid the pandemic. From the CARES Act to the new budget proposal, billions of dollars have been allocated towards helping small businesses to get back on their feet.
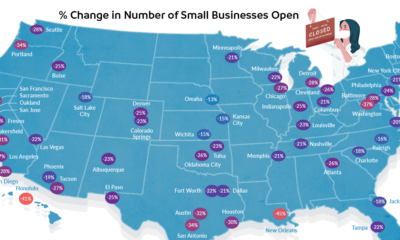
Small Business Recovery in 50 Metro Areas
During the pandemic, many small businesses have either swiftly pivoted to survive, or struggled to stay afloat. This map pulls data from Opportunity Insights to examine the small business recovery rate in 50 metro areas across America. So, has the situation improved since the last time we examined this data? The short answer is no—on a national scale, 34% of small businesses are closed compared to January 2020. San Francisco is one of the most affected metro areas, with a 48% closure rate of small businesses. New York City has spiralled the most since the end of September 2020. Data as of Apr 23, 2021 and indexed to Jan 4-31, 2020. On the flip side, Honolulu has seen the most improvement. As travel and tourism numbers into Hawaii have steadily risen up with lifted nationwide restrictions, there has been a 16 p.p. increase in open businesses compared to September 2020.
Road to a K-Shaped Recovery
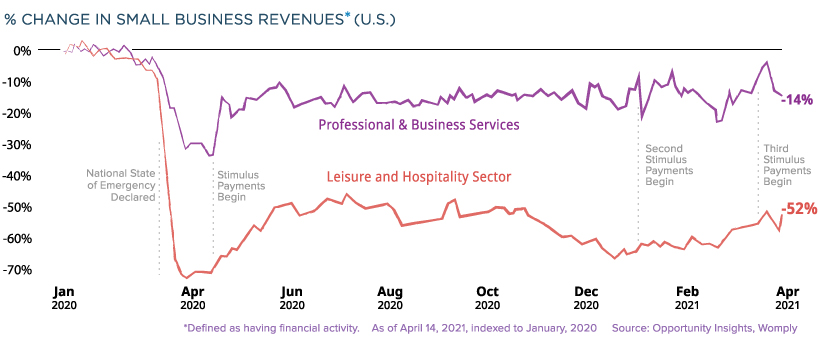
As of April 25, 2021, nearly 42% of the U.S. population has received at least one dose of a COVID-19 vaccine. However, even with this rapid vaccine rollout, various segments of the economy aren’t recovering at the same pace. Take for instance the stark difference between professional services and the leisure and hospitality sector. Though small business revenues in both segments have yet to return to pre-pandemic levels, the latter has much more catching up to do:
This uneven phenomena is known as a K-shaped recovery, where some industries see more improvement compared to others that stagnate in the aftermath of a recession.
The Entrepreneurial Spirit Endures
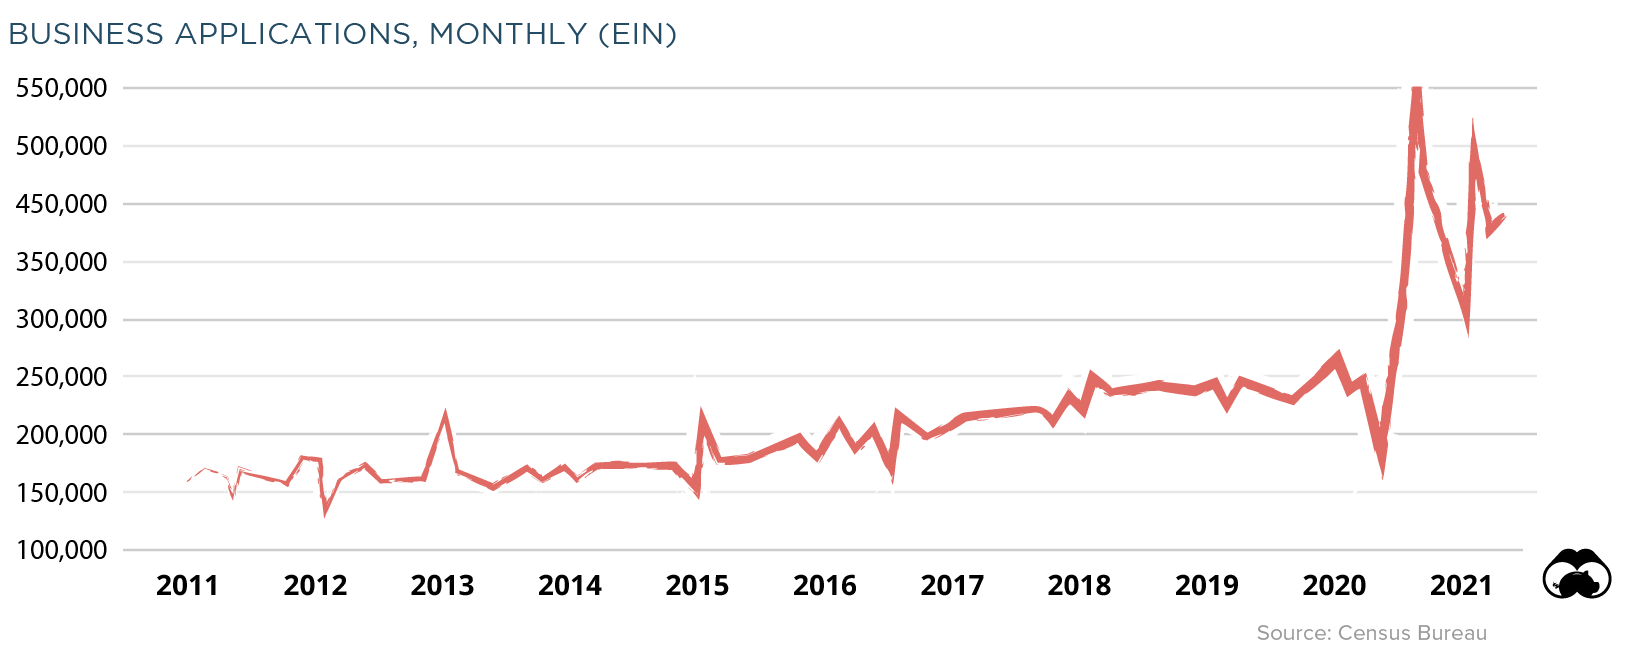
Despite these continued hardships, it appears that many Americans have not been deterred from starting their own businesses. Many small businesses require an Employer Identification Number (EIN) which makes EIN applications a good proxy for business formation activity. Despite an initial dip in the early months of the pandemic, there has been a dramatic spike in EIN business applications.
Even in the face of a global pandemic, the perseverance of such metrics prove that the innovative American spirit is unwavering, and spells better days to come for small business recovery. on Last year, stock and bond returns tumbled after the Federal Reserve hiked interest rates at the fastest speed in 40 years. It was the first time in decades that both asset classes posted negative annual investment returns in tandem. Over four decades, this has happened 2.4% of the time across any 12-month rolling period. To look at how various stock and bond asset allocations have performed over history—and their broader correlations—the above graphic charts their best, worst, and average returns, using data from Vanguard.
How Has Asset Allocation Impacted Returns?
Based on data between 1926 and 2019, the table below looks at the spectrum of market returns of different asset allocations:
We can see that a portfolio made entirely of stocks returned 10.3% on average, the highest across all asset allocations. Of course, this came with wider return variance, hitting an annual low of -43% and a high of 54%.
A traditional 60/40 portfolio—which has lost its luster in recent years as low interest rates have led to lower bond returns—saw an average historical return of 8.8%. As interest rates have climbed in recent years, this may widen its appeal once again as bond returns may rise.
Meanwhile, a 100% bond portfolio averaged 5.3% in annual returns over the period. Bonds typically serve as a hedge against portfolio losses thanks to their typically negative historical correlation to stocks.
A Closer Look at Historical Correlations
To understand how 2022 was an outlier in terms of asset correlations we can look at the graphic below:
The last time stocks and bonds moved together in a negative direction was in 1969. At the time, inflation was accelerating and the Fed was hiking interest rates to cool rising costs. In fact, historically, when inflation surges, stocks and bonds have often moved in similar directions. Underscoring this divergence is real interest rate volatility. When real interest rates are a driving force in the market, as we have seen in the last year, it hurts both stock and bond returns. This is because higher interest rates can reduce the future cash flows of these investments. Adding another layer is the level of risk appetite among investors. When the economic outlook is uncertain and interest rate volatility is high, investors are more likely to take risk off their portfolios and demand higher returns for taking on higher risk. This can push down equity and bond prices. On the other hand, if the economic outlook is positive, investors may be willing to take on more risk, in turn potentially boosting equity prices.
Current Investment Returns in Context
Today, financial markets are seeing sharp swings as the ripple effects of higher interest rates are sinking in. For investors, historical data provides insight on long-term asset allocation trends. Over the last century, cycles of high interest rates have come and gone. Both equity and bond investment returns have been resilient for investors who stay the course.