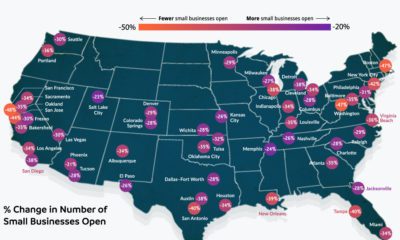
Unfortunately, lockdown and work-from-home measures brought about by COVID-19 have disproportionately affected small businesses – particularly in the leisure and hospitality sectors. As metro-level data from Opportunity Insights points out, geography makes a great deal of difference in the proportion of U.S. small businesses that have flipped their open sign. While some cities are mostly back to business as usual, others are in a situation where the majority of small businesses are still shuttered.
The Big Picture
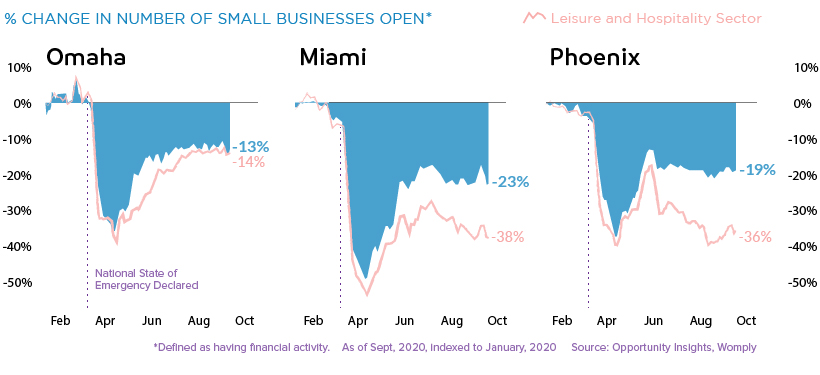
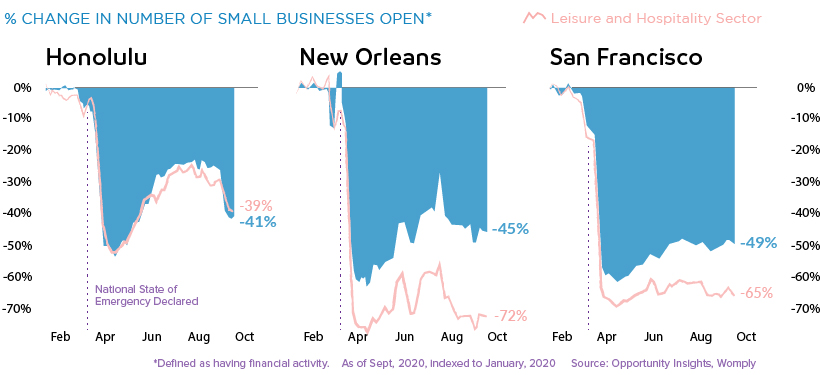
In the U.S. as a whole, data suggests that nearly a quarter of all small businesses remain closed. Of course, the situation on the ground differs from place to place. Here’s how cities around the country are doing, sorted by percentage of small businesses closed as of September 2020: New Orleans and the Bay Area are still experiencing rates of small business closures that are almost double the national median. Small businesses in the leisure and hospitality sector have been particularly hard hit, with 37% reporting no transaction data.
Getting Back to Business
Some cities are seeing rates of small business operation that are nearing pre-pandemic levels.
Of the cities covered in the data set, Omaha had the highest rate of small businesses open.
Still Shuttered
In cities with a large technology sector, such as San Francisco and Austin, COVID-19 is shaking up the economic patterns as entire companies switched to remote working almost overnight. This is bad news for the constellation of restaurants and services that cater to those workers.
Likewise, cities that have an economy built around serving visitors – Honolulu and New Orleans, for example – have seen a very high rate of small business closures as vacations and conferences have been paused indefinitely. As the pandemic drags on, many of these temporary closures are looking to be permanent. Yelp recently reported that of the restaurants marked as closed on their platform, 61% are shut down permanently. As well, businesses in the retail and nightlife categories also saw more than half of closures become permanent.
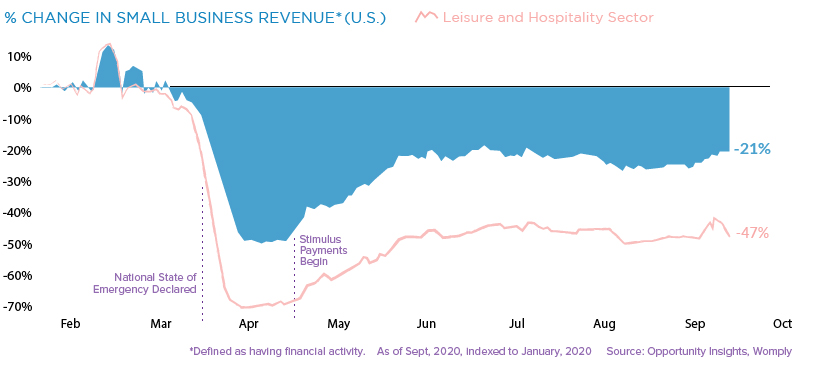
In Remembrance of Revenue
A business being completely closed is a definitive measure, but it doesn’t tell the whole story. Even for businesses that remained open, revenue is often far below pre-pandemic rates.
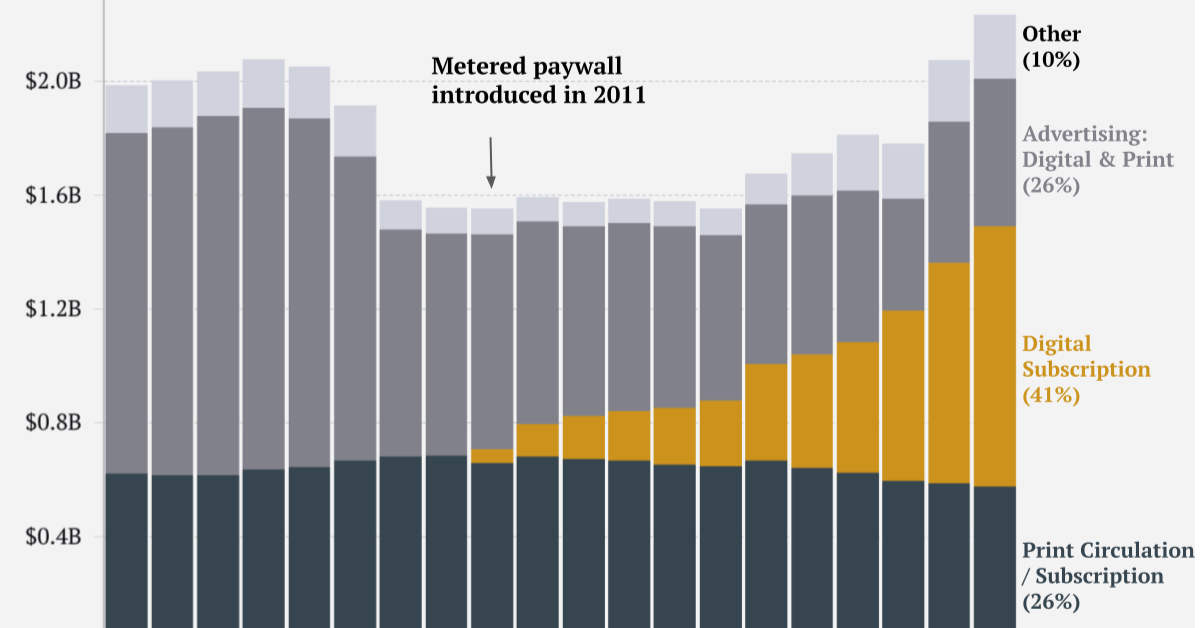
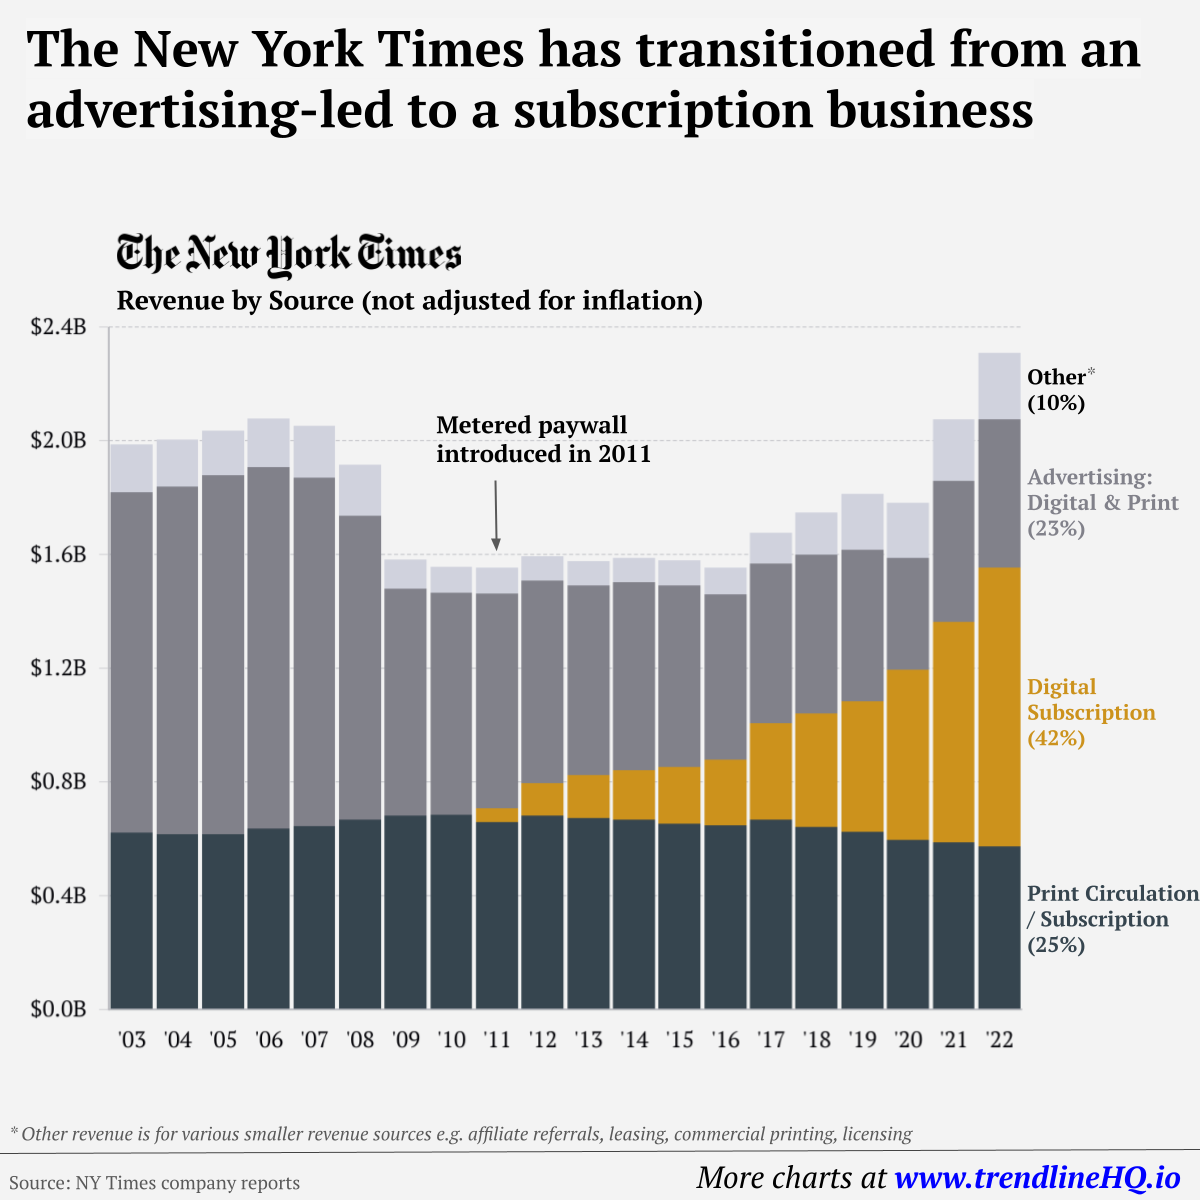
Once again, businesses in the leisure and hospitality sector have been hit the hardest, with revenue falling by almost half since the beginning of 2020. At present, it’s hard to predict when, or even if, economic activity will completely recover. Though travel and some level of in-office work will eventually ramp back up, the small business landscape will continue to face major upheaval in the meantime. on Similar to the the precedent set by the music industry, many news outlets have also been figuring out how to transition into a paid digital monetization model. Over the past decade or so, The New York Times (NY Times)—one of the world’s most iconic and widely read news organizations—has been transforming its revenue model to fit this trend. This chart from creator Trendline uses annual reports from the The New York Times Company to visualize how this seemingly simple transition helped the organization adapt to the digital era.
The New York Times’ Revenue Transition
The NY Times has always been one of the world’s most-widely circulated papers. Before the launch of its digital subscription model, it earned half its revenue from print and online advertisements. The rest of its income came in through circulation and other avenues including licensing, referrals, commercial printing, events, and so on. But after annual revenues dropped by more than $500 million from 2006 to 2010, something had to change. In 2011, the NY Times launched its new digital subscription model and put some of its online articles behind a paywall. It bet that consumers would be willing to pay for quality content. And while it faced a rocky start, with revenue through print circulation and advertising slowly dwindling and some consumers frustrated that once-available content was now paywalled, its income through digital subscriptions began to climb. After digital subscription revenues first launched in 2011, they totaled to $47 million of revenue in their first year. By 2022 they had climbed to $979 million and accounted for 42% of total revenue.
Why Are Readers Paying for News?
More than half of U.S. adults subscribe to the news in some format. That (perhaps surprisingly) includes around four out of 10 adults under the age of 35. One of the main reasons cited for this was the consistency of publications in covering a variety of news topics. And given the NY Times’ popularity, it’s no surprise that it recently ranked as the most popular news subscription.