According to the U.S. Energy Information Administration (EIA), the country accounted for nearly 15% of the world’s total oil production in 2020, churning out close to 13 million barrels of crude oil per day—more than Russia or Saudi Arabia. Although total U.S. oil production declined between 1985 and 2008, annual production increased nearly every year from 2009 through 2019, reaching the highest amount on record in 2019.
The Dominant Oil Producing States
Impressively, 71% of total U.S. oil production came from just five states. An additional 14.6% came from the Gulf of Mexico, which is a federal jurisdiction. Here are the five states that produce the largest amount of crude oil: Rounding the top 10 are states like Alaska, California, Wyoming, Louisiana, and Utah. Texas is undoubtedly the largest oil-producing state in the United States. In 2020, Texas produced a total of 1.78 billion barrels of oil. Texas is home to the most productive U.S. oil basin, the Permian, routinely accounting for at least 50% of total onshore production. A distant second is North Dakota, which produced about 431.2 million barrels of oil in 2020.
Regional Distribution of U.S. Oil Production
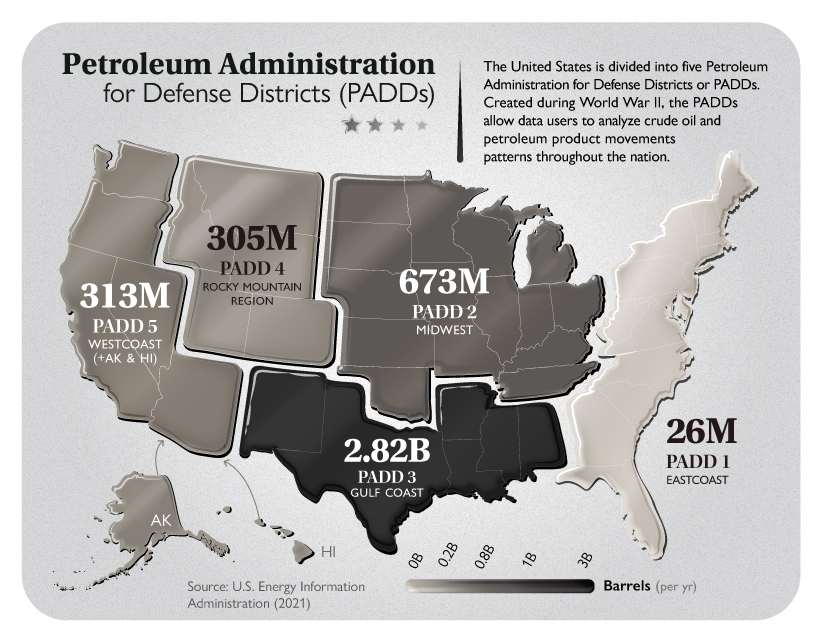
A total of 32 of the 50 U.S. states produce oil. They are divided among five regional divisions for oil production in the U.S., known as the Petroleum Administration for Defense Districts (PADD). These five regional divisions of the allocation of fuels were established in the U.S. during the Second World War and are still used today for data collection purposes.
Given that Texas is the largest U.S. oil-producing state, PADD 3 (Gulf Coast) is also the largest oil-producing PADD. PADD 3 also includes the federal offshore region in the Gulf of Mexico. There are around 400 operational oil and gas rigs in the country.
Impact of U.S. Oil Production on Employment
Rapid growth in oil production using advanced drilling methods has created high-paying jobs in states like North Dakota and Texas. Thanks to the rapid development in the Bakken Shale formation, North Dakota boasts the nation’s lowest unemployment rate. The state has also grown personal income and state economic output at a fast rate, due to oil and gas industry growth. Oil production from the Eagle Ford Shale has transformed a relatively poor region of South Texas into one of the nation’s most significant economic development zones. In fact, due largely to the oil and natural gas industry, the Texas Comptroller estimates that Texas has recovered 100% of the jobs lost during the Great Recession.
Looking to the Future
The U.S. slashed its oil production forecast through next year just as OPEC and its allies begin to roll back their production cuts in the coming months. U.S. oil output will drop to 11.04 million barrels a day this year, down from a forecasted 11.15 million. This was a result of the deep freeze that shut down the oil industry in Texas. The EIA also lowered its output forecast for 2022 by 100,000 barrels a day. Despite its forecast for a rise in supply from outside the cartel this year, OPEC said in its report that it is uncertain about the levels of investment expected to determine the non-OPEC supply outlook for the years to come. on
#1: High Reliability
Nuclear power plants run 24/7 and are the most reliable source of sustainable energy. Nuclear electricity generation remains steady around the clock throughout the day, week, and year. Meanwhile, daily solar generation peaks in the afternoon when electricity demand is usually lower, and wind generation depends on wind speeds.As the use of variable solar and wind power increases globally, nuclear offers a stable and reliable backbone for a clean electricity grid.
#2: Clean Electricity
Nuclear reactors use fission to generate electricity without any greenhouse gas (GHG) emissions.Consequently, nuclear power is the cleanest energy source on a lifecycle basis, measured in CO2-equivalent emissions per gigawatt-hour (GWh) of electricity produced by a power plant over its lifetime. The lifecycle emissions from a typical nuclear power plant are 273 times lower than coal and 163 times lower than natural gas. Furthermore, nuclear is relatively less resource-intensive, allowing for lower supply chain emissions than wind and solar plants.
#3: Stable Affordability
Although nuclear plants can be expensive to build, they are cost-competitive in the long run. Most nuclear plants have an initial lifetime of around 40 years, after which they can continue operating with approved lifetime extensions. Nuclear plants with lifetime extensions are the cheapest sources of electricity in the United States, and 88 of the country’s 92 reactors have received approvals for 20-year extensions. Additionally, according to the World Nuclear Association, nuclear plants are relatively less susceptible to fuel price volatility than natural gas plants, allowing for stable costs of electricity generation.
#4: Energy Efficiency
Nuclear’s high energy return on investment (EROI) exemplifies its exceptional efficiency. EROI measures how many units of energy are returned for every unit invested in building and running a power plant, over its lifetime. According to a 2018 study by Weissbach et al., nuclear’s EROI is 75 units, making it the most efficient energy source by some distance, with hydropower ranking second at 35 units.
#5: Sustainable Innovation
New, advanced reactor designs are bypassing many of the difficulties faced by traditional nuclear plants, making nuclear power more accessible.
Small Modular Reactors (SMRs) are much smaller than conventional reactors and are modular—meaning that their components can be transported and assembled in different locations. Microreactors are smaller than SMRs and are designed to provide electricity in remote and small market areas. They can also serve as backup power sources during emergencies.
These reactor designs offer several advantages, including lower initial capital costs, portability, and increased scalability.
A Nuclear-Powered Future
Nuclear power is making a remarkable comeback as countries work to achieve climate goals and ultimately, a state of energy utopia. Besides the 423 reactors in operation worldwide, another 56 reactors are under construction, and at least 69 more are planned for construction. Some nations, like Japan, have also reversed their attitudes toward nuclear power, embracing it as a clean and reliable energy source for the future. CanAlaska is a leading exploration company in the Athabasca Basin, the Earth’s richest uranium depository. Click here to learn more now. In part 3 of the Road to Energy Utopia series, we explore the unique properties of uranium, the fuel that powers nuclear reactors.