Today, exports make up roughly 25% of total global production. One of the common influences on these exports, unsurprisingly, is oil. In fact, petroleum is the top export across over 50 nations, and along with many other resource-driven materials makes up a sizable share of the global export market. Since 2000, the total value of all exported global trade of goods and services has tripled to $19.5 trillion. This infographic from HowMuch.net shows the top export in every country by value, according to the most recent global data from 2018.
Top Exports, by Region
Let’s dive into some particular regions, to see how top exports can vary: Editor’s note: for even larger versions of each regional infographic below, visit HowMuch.net. All export data is from 2018 and comes from CEPII, a leading French center of economic analysis.
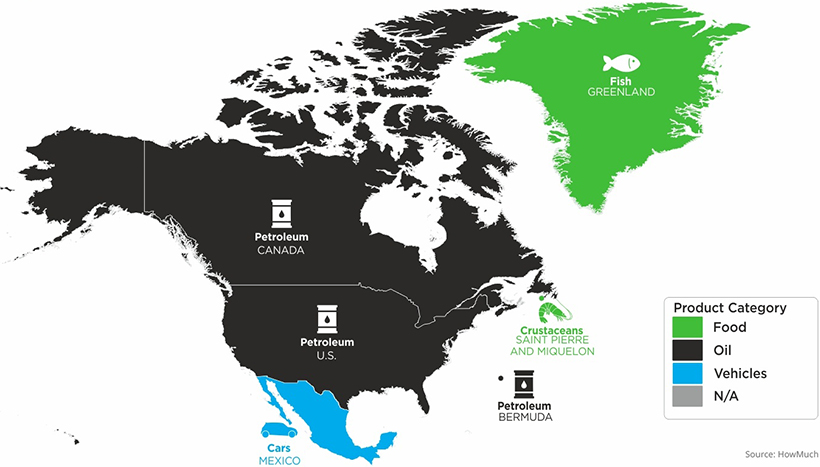
North America
In the U.S. petroleum outpaces all other exports, with crude oil accounting for 35% of total petroleum exports. Canada too, lists petroleum at the top.
With a market valued at $50.7 billion, Mexico’s top export is cars—making it the fourth largest exporter worldwide.
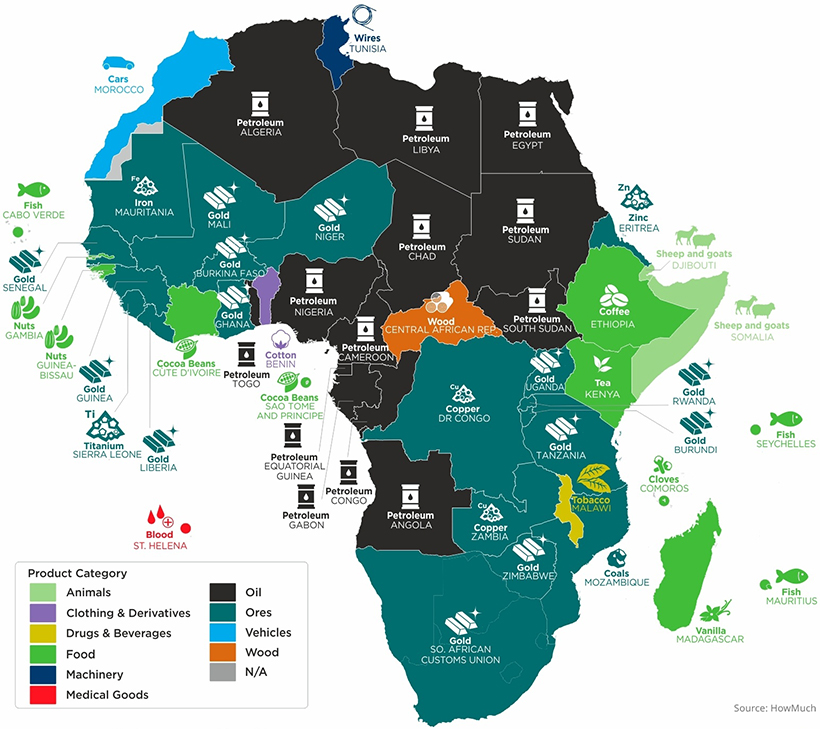
Africa
From Egypt to Senegal, Africa has a diverse spectrum of exports. Primarily, these are resource-driven, with the top five exports being petroleum, gold, diamonds, natural gas, and coal. Meanwhile, Ethiopia’s top export is coffee, shipping nearly $1 billion alone in 2018. Similarly, off the east coast, Madagascar is the world’s largest producer of vanilla.
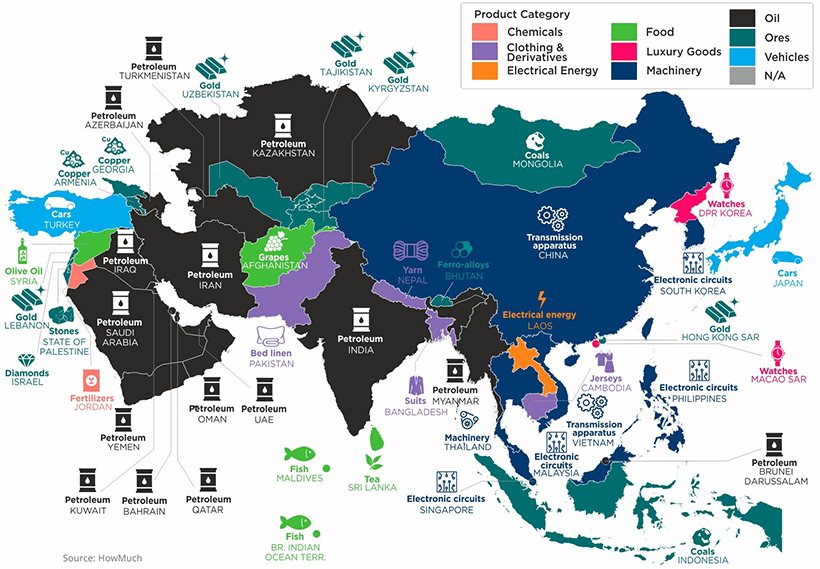
Asia
While petroleum is also a dominant export across many countries in Asia, the region’s export landscape is a lot more tech-focused. In South Korea, electronic circuits are the largest export. Samsung, headquartered in Seoul, is a major supplier to Apple for multiple electronic components. With one of the highest export ratios in Asia, 40% of South Korea’s economic output is derived from its export market. Here are the top exports across other Asian countries. In Afghanistan, grapes are the top export, valued at $237 million. Almost one-fifth of Afghanistan’s exports come from the grape industry.
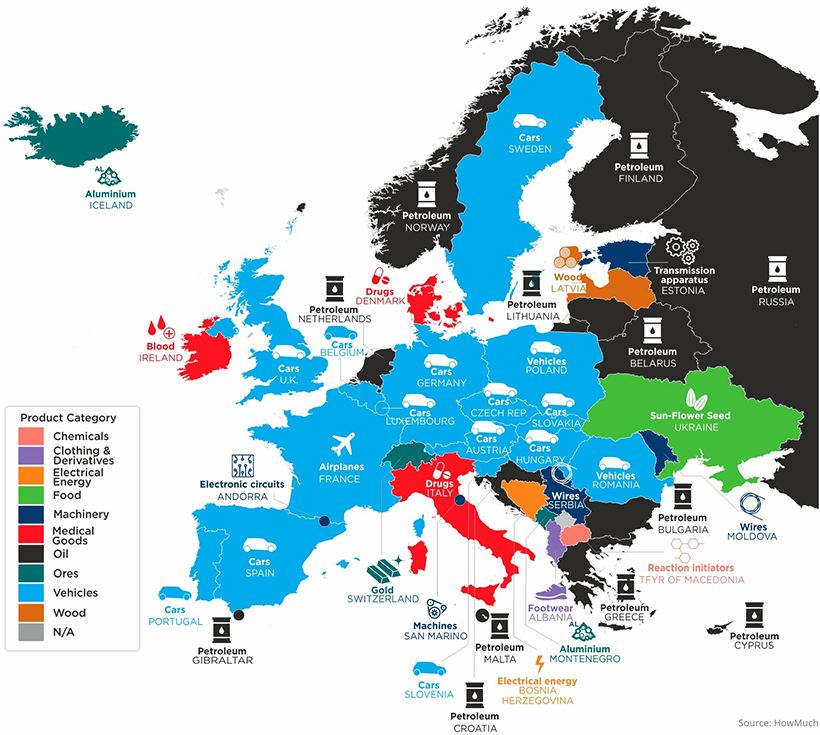
Europe
Across the European continent, the automotive industry stands out as a primary driver of exports, with 14 countries having cars or vehicles as their most exported good. In fact, in 2019, the European Union exported a total of 5.6 million motor vehicles. Of these, 28% were shipped to the U.S. and 16.5% to China. The Balkan nation of Albania has footwear as its top export. Overall, nearly 80% of the nation’s GDP relies on goods and services exports. France, on the other hand, has airplanes as its highest export while Italy and Denmark’s highest are drugs. Italy is the top producer of pharmaceuticals in Europe, an industry which employs 66,500 across the country. Globally, it makes up 2.8% of pharmaceutical sales. Due to its cheap electricity prices, companies have flocked to Iceland to produce aluminum. Iceland’s dams, which generate power from glacial water, produce electricity as much as 30% cheaper than in America.
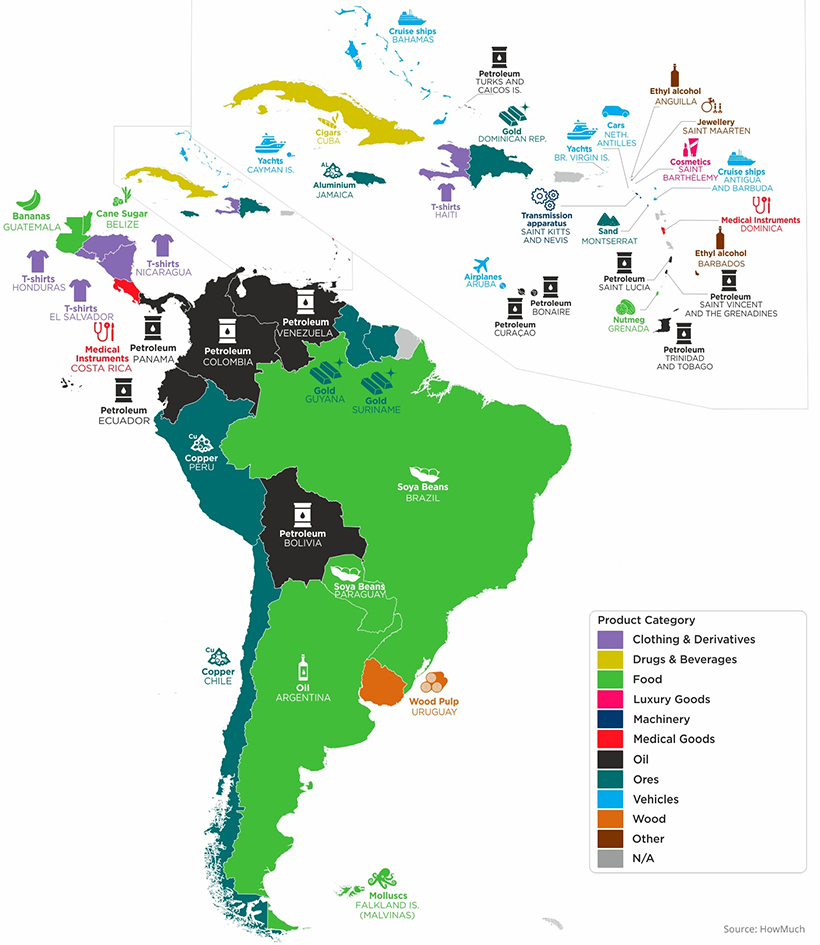
Latin America & the Caribbean Islands
Like other regions, petroleum stands out as a key export in countries across Latin America. Take Venezuela. With the largest oil reserves in the world, its oil exports were valued at $90 billion annually ten years ago. Since the pandemic, however, earnings are projected to reach just a fraction of this total—only $2.3 billion this year. Along with this, the U.S. has imposed sanctions on president Nicolás Maduro and Venezuela’s state oil company, PDVSA, causing oil exports to slump to their lowest point in nearly 80 years. For Caribbean nations, unsurprisingly, many top exports in this region are linked to tourism. Cruise ships stood out as a primary export in the Bahamas, while yachts were most significant in the Cayman Islands. However, due to the pandemic, many of these national economies are at heightened risk, with some economies across the region projected to contract 10% in 2020.
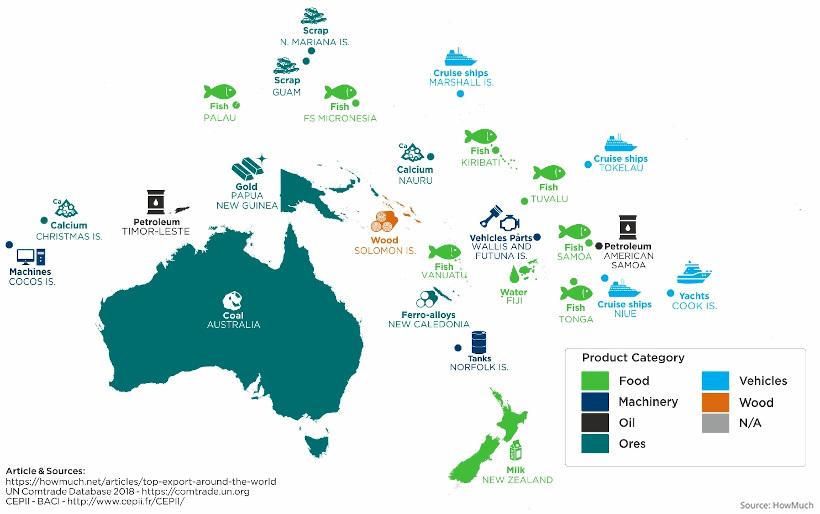
Oceania
Finally, in Oceania, Australia had coal as it’s top export in 2018 (though it has since switched to iron ore in 2019), while New Zealand sends milk abroad. For many of the smaller islands throughout the Pacific, it can be seen that fish, cruise ships, water, and yachts are key exports.
The Future of Trade
Now, COVID-19 and a host of other factors are changing the way the world trades. Unexpected shocks, trade wars, the carbon footprint, and labor standards are influencing firms to build more resilient supply chains. According to The Economist, it’s estimated that over the next five years that 16-26% of exported goods production could shift locations. on Last year, stock and bond returns tumbled after the Federal Reserve hiked interest rates at the fastest speed in 40 years. It was the first time in decades that both asset classes posted negative annual investment returns in tandem. Over four decades, this has happened 2.4% of the time across any 12-month rolling period. To look at how various stock and bond asset allocations have performed over history—and their broader correlations—the above graphic charts their best, worst, and average returns, using data from Vanguard.
How Has Asset Allocation Impacted Returns?
Based on data between 1926 and 2019, the table below looks at the spectrum of market returns of different asset allocations:
We can see that a portfolio made entirely of stocks returned 10.3% on average, the highest across all asset allocations. Of course, this came with wider return variance, hitting an annual low of -43% and a high of 54%.
A traditional 60/40 portfolio—which has lost its luster in recent years as low interest rates have led to lower bond returns—saw an average historical return of 8.8%. As interest rates have climbed in recent years, this may widen its appeal once again as bond returns may rise.
Meanwhile, a 100% bond portfolio averaged 5.3% in annual returns over the period. Bonds typically serve as a hedge against portfolio losses thanks to their typically negative historical correlation to stocks.
A Closer Look at Historical Correlations
To understand how 2022 was an outlier in terms of asset correlations we can look at the graphic below:
The last time stocks and bonds moved together in a negative direction was in 1969. At the time, inflation was accelerating and the Fed was hiking interest rates to cool rising costs. In fact, historically, when inflation surges, stocks and bonds have often moved in similar directions. Underscoring this divergence is real interest rate volatility. When real interest rates are a driving force in the market, as we have seen in the last year, it hurts both stock and bond returns. This is because higher interest rates can reduce the future cash flows of these investments. Adding another layer is the level of risk appetite among investors. When the economic outlook is uncertain and interest rate volatility is high, investors are more likely to take risk off their portfolios and demand higher returns for taking on higher risk. This can push down equity and bond prices. On the other hand, if the economic outlook is positive, investors may be willing to take on more risk, in turn potentially boosting equity prices.
Current Investment Returns in Context
Today, financial markets are seeing sharp swings as the ripple effects of higher interest rates are sinking in. For investors, historical data provides insight on long-term asset allocation trends. Over the last century, cycles of high interest rates have come and gone. Both equity and bond investment returns have been resilient for investors who stay the course.