In recent years, an impressive number of companies have stepped up to take a more active role in shaping a more sustainable future—not just in the environmental sense, but also by taking social and governance factors into consideration. Today’s chart draws from the Corporate Knights Global 100, an annual ranking of the 100 most sustainable companies, to visualize exactly how many are located in each corner of the world. The companies on the list are clear winners not only because they aim to leave the world a better place, but because their stocks have also outperformed the market on average.
How is Corporate Sustainability Measured?
The researchers rely on readily available data for all publicly-listed companies with at least $1 billion in gross revenue (in PPP), as of the financial year 2018. Companies are then screened for several key performance indicators (KPIs), including but not limited to the following categories and examples:
Resource management Example: GHGs and other emissions such as NOx and SOx emissions Financial management Example: Innovation capacity, or the percentage of R&D spending against total revenue Employee management Example: Women in executive management and/or on boards Clean revenue Example: The percentage of total revenue derived from “clean” products and services
The concentration of the most sustainable companies also varies greatly depending on where you look. Here’s a closer view of every region.
Europe: 49/100 Sustainable Companies
Europe is front-and-center in the tidal shift towards more sustainable business, driven by far-reaching regulations. With this in mind, it’s perhaps not surprising to see that Europe is a hotbed of activity. Nearly half the world’s most sustainable companies are located in Europe. France paves the way with nine sustainable companies in the ranking, followed by Finland with six companies of 100. Denmark’s Ørsted A/S claims the top of the leaderboard in 2020. Within a decade, the company has completely transformed its business model—shifting away from the Danish Oil and Natural Gas (DONG) company into a pure play renewable energy company. The company recognized the importance of this transition: —Henrik Poulsen, CEO Just 10 years ago, DONG was 85%-fossil fuel based, and only 15%-renewables based. Today, Ørsted has flipped these proportions. The company attributes its dramatic transformation to the societal demand for green energy, and aims to be carbon-neutral by 2025.
North America: 29/100 Sustainable Companies
In this region, the U.S. alone is responsible for 17 of the top 100 sustainable companies in the world. What’s more, of the 28 new companies to the 2020 Ranking, Canada is the homebase for nine of these entrants. Cisco Systems comes in fourth worldwide, partly as a result of its clean revenues worth a stunning $25 billion. Not far behind is Autodesk, which rose an impressive 43 places since 2019. The main factor behind this leap? The software corporation now operates its cloud platforms using 99% renewable energy.
Asia: 16/100 Sustainable Companies
Over in Asia, Japan is a clear leader, boasting six sustainable companies in the list. Interestingly, the companies are from a wide range of industries, from computers (Panasonic) to cars (Toyota). Japanese plastics manufacturer Sekisui Chemicals comes in first in Asia, after an immense improvement of 77 positions in just one year. The company builds environmentally-friendly housing, and 28% of its revenue aligns with the UN’s Sustainable Development Goals (SDGs).
Rest of the World: 6/100 Sustainable Companies
There are a few notable mentions in other regions, too. Brazil’s Banco do Brasil remains in the top ten list, and is one of the three most sustainable companies in all of South America. More than half of the companies in these remaining regions are banks. Incidentally, financial services are the biggest group in the Global 100 overall.
The Best of Both Worlds
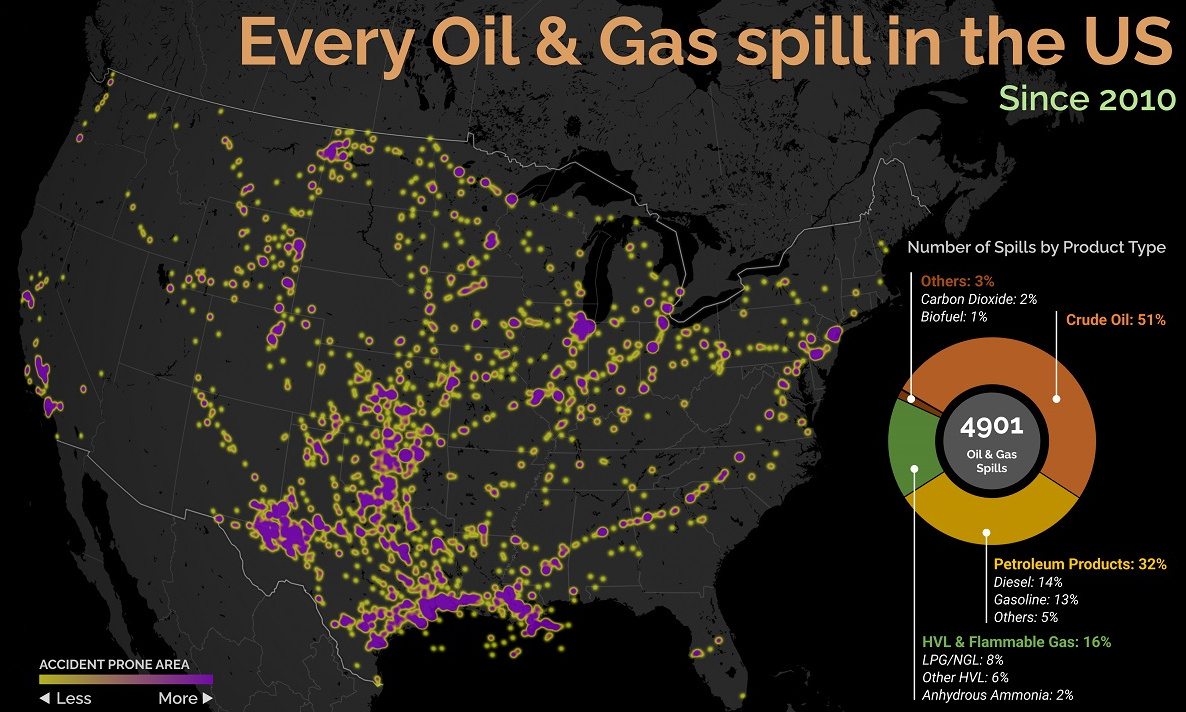
As it turns out, you can have your cake and eat it, too. Altogether, the Global 100 most sustainable companies have consistently outperformed*, and outlasted the average company in the MSCI ACWI (All Country World Index): Corporate sustainability is a significant driving force for urgent climate action, and the sustainable companies on this list acknowledge the triple bottom line of not just making profit, but also creating a lasting impact on people and the planet. on Aside from the obvious climate impact they bring, one other downside in particular is spills, which can lead to ecological and economic damage. These can happen due to pipeline leaks, train derailments, or other industrial disasters. This graphic from Preyash Shah provides a visual overview of every oil and gas spill in the contiguous U.S. since 2010. Data is tracked by the U.S. government’s Pipeline and Hazardous Materials Safety Administration (PHMSA).
U.S. Oil and Gas Spills (2010‒2022)
The majority of spills that have occurred come mostly from crude oil, followed by petroleum products and gas. Note that this data covers the quantity of spills and not damages or volume.
Crude oil, which makes up just over half of documented spills, is also one of the most costly. Contaminations can persist for years after a spill, and its impact on local mammals and waterfowl is particularly harsh. This has been the case with the Deepwater Horizon spill (also known as the “BP oil spill”), which experts say is still causing harm in the Gulf of Mexico. Other products with lots of spills include petroleum products such as diesel or gasoline, as well as liquefied natural gas or other volatile liquids. Interestingly, liquefied carbon dioxide can also be transported in pipelines, commonly used for carbon capture storage, but requires high pressure to maintain its state. When looking at the location of spills, it’s clear that the South Central states have experienced the highest number of disasters. In contrast, the West Coast has had substantially less activity. However, this makes much more sense when looking at the dominant oil producing states, where Texas and surrounding neighbors reign supreme. Of the 4,901 spills during this period, Texas accounts for 1,936 or roughly 40% of all oil and gas spills. This is followed by Oklahoma, which has had 407 spills and is one of the largest net exporters of oil and gas in the country.
What Causes Spills?
Oil and gas spills actually have a surprisingly long history, with one of the earliest dating back to 1889, when a spill was reported on the coast between Los Angeles and San Diego. Causes have consisted primarily of weather, natural disasters, equipment and technological malfunction, as well as human error. However, they only became a widespread problem around the halfway mark of the 20th century, when petroleum extraction and production really began to take off. This era also saw the emergence of supertankers, which can transport half a million tons of oil but therefore make the risk of spills even costlier. In fact, the biggest spill off U.S. waters after the Deepwater Horizon disaster is the 1989 Exxon Valdez spill in Alaska, when a tanker crashed into a reef and 11 million gallons of oil spilled into the Pacific Ocean.